
xgis-plot
v0.0.4
Published
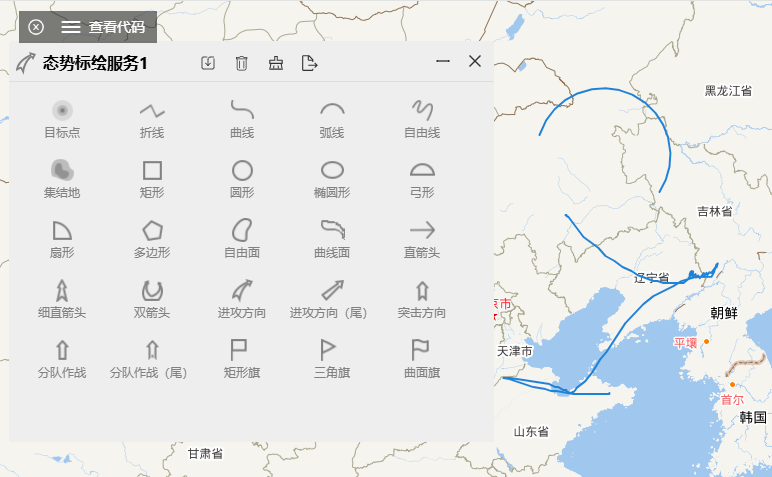
OL态势标绘库封装
Downloads
25
Maintainers
 zorrowm
Readme
xgis-plot
基于openlayers 10.x的态势标绘库xgis-plot
- v0.0.4 升级依赖库版本到最新版;
- v0.0.3 升级ol版本到8.2.0,与xgis-ol的最新版匹配;
- v0.0.2 可用版,解决拖拽、删除和添加属性等BUG;解决标绘要素GeoJson导出和导入的BUG;
- v0.0.1 基于openlayers 7.x的态势标绘库
What Works:
- 点:点
- 线: 弧线 曲线 折线 自由线
- 面: 圆 椭圆 弓形 扇形 曲线面 多边形 矩形 自由面 聚集地
- 箭头: 钳击 直箭头 细直箭头 突击方向 进攻方向 进攻方向(尾) 分队战斗行动 分队战斗行动(尾)
- 操作 :上移 下移 置顶 置底 全部清除 屏蔽点击 激活点击
- 添加属性
Installation
yarn add xgis-plot ol
or
npm i xgis-plot ol
Usage
import {Map} from 'ol';
import {PlotOL,PlotTypes} from 'xgis-plot';
import 'xgis-ol/dist/index.css';

const plotHelper=new PlotOL(map,{layerName:'plot-drawLayer'});
//获得当前矢量图层
thisDrawLayer=plotHelper.plotDraw.drawLayer;
//标绘
plotHelper.activate(PlotTypes.ELLIPSE);
//删除当前选中要素
plotHelper.removeFeature();
//删除所有的
plotHelper.removeAllFeatures();
//导出当前选中要素为GeoJson对象
plotHelper.getCurrentFeaGeoJSON();
//导出要素为GeoJson对象数组
plotHelper.getAllFeatureGeoJSONs();
示例PlotMapWidget.vue
与xgis-ol、xframelib配合使用的态势标绘Widget,完整源码:
<template>
  <XWindow
    :isDark="false"
    top="40px"
    left="10px"
    nWidth="485px"
    hHeight="400px"
    @loaded="loadedHandle"
    @close="doClosePanel"
  >
  <template #title>
    <img  src="img/drawImg/AttackArrow.png" width="24" height="24" />
    <span  class="paneltitle">态势标绘服务1</span>
    <div class="justify-between toolbar">
      <span title="导出JSON" @click="importPlotJson">
      <Icon icon="system-uicons:import"/>
    </span>
      <span title="删除当前" @click="deleteThis">
      <Icon icon="mdi-light:delete"  />
      </span>
      <span title="清空全部" @click="clearAll">
      <Icon icon="ant-design:clear-outlined" />
      </span>
      <span title="导出JSON" @click="exportPlotJson">
      <Icon icon="carbon:document-export" />
    </span>
    </div>
  </template>
  <template #default>
    <div class="clearfix">
      <ul>
        <li v-for="(item,index) in plotTypeList" class="ol-plot-li" @click="drawFigureClickFun(item.name)">
          <span class="pic-li" :style="getItemStyle(item)"></span>
          <span>{{ item.label }}</span>
        </li>
      </ul>
    </div>
  </template>
  </XWindow>
  <q-uploader ref="profileUploader" :max-files="1" class="hidden" accept=".json" field-name="file"
  @added="fileUpload" />
</template>

<script setup lang="ts">
import { getCurrentInstance, ref, onMounted, onUnmounted } from 'vue';
import { Global, SaveAs, XWindow,H5Tool } from 'xframelib';
import PlotOL,{PlotTypes} from 'xgis-plot';
import 'xgis-plot/dist/index.css';
import {XMap} from 'xgis-ol';
import {Vector as VectorLayer} from 'ol/layer';

const instance = getCurrentInstance();
let windowID = '';
function loadedHandle(panelData) {
  windowID = panelData.id;
}
function doClosePanel(panelData) {
  const wid = instance?.proxy?.$options.id;
  const layoutid = instance?.proxy?.$options.layoutID;
  if (wid) {
    Global.LayoutMap.get(layoutid)?.unloadWidget(wid);
  }
}

const plotTypeList=ref([
 {
    name:PlotTypes.POINT,
    label:'目标点',
    img:'Point.png'
  },
  {
    name:PlotTypes.POLYLINE,
    label:'折线',
    img:'Polyline.png'
  },
  {
    name:PlotTypes.CURVE,
    label:'曲线',
    img:'Curve.png'
  },
  {
    name:PlotTypes.ARC,
    label:'弧线',
    img:'ArcLine.png'
  },
  {
    name:PlotTypes.FREEHANDLINE,
    label:'自由线',
    img:'FreeHandLine.png'
  },
  {
    name:PlotTypes.GATHERING_PLACE,
    label:'集结地',
    img:'GatheringPlace.png'
  },

  {
    name:PlotTypes.RECTANGLE,
    label:'矩形',
    img:'RectAngle.png'
  },
  {
    name:PlotTypes.CIRCLE,
    label:'圆形',
    img:'Circle.png'
  },
  {
    name:PlotTypes.ELLIPSE,
    label:'椭圆形',
    img:'Ellipse.png'
  },
  {
    name:PlotTypes.LUNE,
    label:'弓形',
    img:'Arc.png'
  },
  {
    name:PlotTypes.SECTOR,
    label:'扇形',
    img:'Sector.png'
  },
  {
    name:PlotTypes.POLYGON,
    label:'多边形',
    img:'Polygon.png'
  },
  {
    name:PlotTypes.FREE_POLYGON,
    label:'自由面',
    img:'FreePolygon.png'
  },
  {
    name:PlotTypes.CLOSED_CURVE,
    label:'曲线面',
    img:'ClosedCurve.png'
  },
  //箭头
  {
    name:PlotTypes.STRAIGHT_ARROW,
    label:'直箭头',
    img:'StraightArrow.png'
  },
  {
    name:PlotTypes.FINE_ARROW,
    label:'细直箭头',
    img:'FineArrow.png'
  },
  {
    name:PlotTypes.DOUBLE_ARROW,
    label:'双箭头',
    img:'DoubleArrow.png'
  },

  //进攻方向
  {
    name:PlotTypes.ATTACK_ARROW,
    label:'进攻方向',
    img:'AttackArrow.png'
  },
  {
    name:PlotTypes.TAILED_ATTACK_ARROW,
    label:'进攻方向(尾)',
    img:'TailedAttackArrow.png'
  },
  {
    name:PlotTypes.ASSAULT_DIRECTION,
    label:'突击方向',
    img:'AssaultDirection.png'
  },
  {
    name:PlotTypes.SQUAD_COMBAT,
    label:'分队作战',
    img:'SquadCombat.png'
  },
  {
    name:PlotTypes.TAILED_SQUAD_COMBAT,
    label:'分队作战(尾)',
    img:'TailedSquadCombat.png'
  },

  //旗帜
  // {
  //   name:PlotTypes.PENNANT,
  //   label:'信号旗',
  //   img:'Pennant.png'
  // },
  {
    name:PlotTypes.RECTFLAG,
    label:'矩形旗',
    img:'RectFlag.png'
  },
  {
    name:PlotTypes.TRIANGLEFLAG,
    label:'三角旗',
    img:'TriangleFlag.png'
  },
  {
    name:PlotTypes.CURVEFLAG,
    label:'曲面旗',
    img:'CurveFlag.png'
  },

])

function getItemStyle(it)
{
  const imgPath=`img/drawImg/${it.img}`;
  return `background: url('${imgPath}') no-repeat`;
}
let plotHelper:PlotOL;
let xMap: XMap;
let thisDrawLayer:VectorLayer;
onMounted(()=>{
  xMap=Global.XMap as XMap;
  plotHelper = new PlotOL(xMap.map, { layerName: "plotDrawLayer" });
  //当前图层
  thisDrawLayer=plotHelper.plotDraw.drawLayer;
  if(thisDrawLayer)
  {
    const lowerLayerID="plotDrawLayer"
    const layerItem = {
              id: lowerLayerID,
              name: lowerLayerID,
              alias: '态势标绘',
              group: lowerLayerID,
              minZoom: 1,
              maxZoom: 24,
              visible: true,
              opacity: 1,
              type: 'vector'
            };
    xMap.registerLayer(thisDrawLayer,layerItem);
  }
})

//#region 绘制相关操作
/**
 * 删除符号
 */
function deleteThis() {
  plotHelper?.removeFeature();
}
function drawFigureClickFun(type) {
  console.log(type, '--------type');
  plotHelper?.activate(type);
}

function clearAll()
{
  plotHelper?.removeAllFeatures();
}

function exportPlotJson()
{
  const json= plotHelper.getAllFeatureGeoJSONs();
  SaveAs(JSON.stringify(json),'plotResult.json');
}
const profileUploader = ref(null);
function importPlotJson()
{
  if (profileUploader.value) {
    //@ts-ignore
    profileUploader.value.pickFiles();
  }

}

async function fileUpload(files) {
  const file = files[0];
  const name = file.name;

  const data=await H5Tool.readFilePromise(file,'Text') as string;
  const json=JSON.parse(data);
  plotHelper.addFeatures(json);
}

//#endregion
</script>

<style lang="scss" scoped>
.toolbar {
  display: inline-flex;
  width:120px;
  margin-left:50px;
  span>svg:hover{
    border:#1b9de8 2px solid;
  }
}
.ol-plot-li {
  float: left;
  width: 90px;
  height: 60px;
  color: #818181;
  margin-left: 0;
  font-size:12px;
  box-sizing: border-box;
  border: 1px solid transparent;
  text-align: center;
  cursor: pointer;
  &:hover {
    color: #1b9de8;
    border: 1px solid #76c4f1;
  }
  .pic-li {
    width: 25px;
    height: 25px;
    display: block;
    margin: auto;
    margin-top: 10px;
    background-size: 100% 100% !important;
  }
  ul {
    li {
      &:hover {
        cursor: pointer;
      }
    }
  }
}
</style>