
vue-chartify
v1.0.3
Published
A comprehensive and easy-to-use charting library for Vue.js applications. With interactive features and extensive customization options, the Vue Charting Package is the perfect solution for adding data visualizations to your Vue.js applications.
Downloads
18
Maintainers
 behkha
Readme
Vue Chartify
Vue Chartify is a lightweight and easy-to-use library for creating beautiful and interactive charts with Vue.js. Supports the common chart types, such as line and bar chart and more will be added soon.
Features
- Responsive and adaptive to different screen sizes
- Lightweight, efficient, on-demand binding events
- Customizable colors, fonts, lines, and animation
- Supports Vue 3 and TypeScript
Installation
- Use npm:
npm install vue-chartify- Add the css in main.ts
import { createApp } from 'vue'
import App from './App.vue'
import "vue-chartify/style.css"

createApp(App).mount('#app')
- Import the component
<script>
import { defineComponent } from 'vue'
import { VcBarChart, VcLineChart } from 'vue-chartify';
export default defineComponent({
    components: { VcBarChart, VcLineChart },
    // rest of your component
})
</script>
Use the component in template
- Bar Chart
<vc-bar-chart data-source="<YourDataSource>" argument-field="<YourArgumentField>" value-field="<YourValueField>" :show-value-axis-line="true" :show-argument-axis-line="true" :show-value-titles="true" :show-argument-titles="true" :show-value-labels="true" :show-horizontal-grid-lines="true" :show-vertical-grid-lines="true" :bar-colors="['#454d66', '#309975', '#58b368', '#dad873', '#efeeb4', '#454d66', '#309975']" bar-color="red" :bar-radius="5" :animation="true" />- Line Chart
<vc-line-chart
    data-source="<YourDataSource>"
    argument-field="<YourArgumentField>"
    value-field="<YourValueField>"
    :show-value-axis-line="true"
    :show-argument-axis-line="true"
    :show-value-titles="true"
    :show-argument-titles="true"
    :show-value-labels="true"
    :show-horizontal-grid-lines="true"
    :show-vertical-grid-lines="true"
    line-color="#343090"
    :line-width="3"
    :animation="true"
    :show-points="true"
/>
Common Props
* = required
| Name | Type | Default | Description |
| ----------------- | -------------- | ----------- | ------------------- |
| dataSource * | Object[] | [] | Binds the UI component to data |
| argumentField * | String | undefined | Specifies which data source field provides arguments for series points |
| valueField * | String | undefined | Specifies which data source field provides values for series points |
| width | String | 100% | Specifies the width of the UI component |
| height | String | 500px | Specifies the height of the UI component in pixels.edges |
| showValueLabels | Boolean | false | Shows the value as label on data points |
| showArgumentTitles | Boolean | true | Shows the argument (x-axis) titles |
| showValueTitles | Boolean | true | Shows the value (y-axis) titles |
| showValueAxisLine | Boolean | true | Shows the value axis (y-axis) line |
| showArgumentAxisLine | Boolean | true | Shows the argument axis (x-axis) line |
| showHorizontalGridLines | Boolean | false | Shows the horizontal grid
| showVerticalGridLines | Boolean | false | Shows the vertical grid lines |
| horizontalGridLineOptions | Object | {stroke: '#dddddd80', 'stroke-width': '1px'} | Specifies the horizontal grid lines style |
| verticalGridLineOptions | Object | {stroke: '#dddddd80', 'stroke-width': '1px' | Specifies the vertical grid lines
| fontSize | String | 12px | Specify font size value
| fontColor | String | black | Specify font color
| fontFamily | String | Arial, Helvetica, sans-serif | Specify font family
| animation | Boolean | true | Enables the animation in the UI component
| animationDuration | String | 0.5s | Specifies how long the animation runs
| breakpoints | Object | Breakpoints | Specifies breakpoints for chart responsiveness
| customValueLabel | Function | (value: number, index: number) => value | Custom value label function
Specific Props
- Bar Chart Props
| Name | Type | Default | Description |
| ----------------- | -------------- | ----------- | ------------------- |
| barColor | String | black | Specifies bar colors |
| barColors | String[] | [] | Specifies color for each specific bar |
| barRadius | Number | 0 | Specifies bar radius value |
- Line Chart Props
| Name | Type | Default | Description |
| ----------------- | --------| --------| ---------------------------------- |
| lineColor | String | black | Specifies line color |
| lineWidth | Number | 3 | Specifies width value of the line |
| showPoints | Boolean | true | Show the points |
Breakpoints
The default object of Breakpoints has the following properties. The gap value determines the spacing and affects their sizes.
{
xs: {
width: '576px',
gap: '20px'
},
sm: {
width: '768px',
gap: '22px'
},
md: {
width: '992px',
gap: '25px'
},
lg: {
width: '1200px',
gap: '27px'
},
xl: {
width: '1400px',
gap: '30px'
}
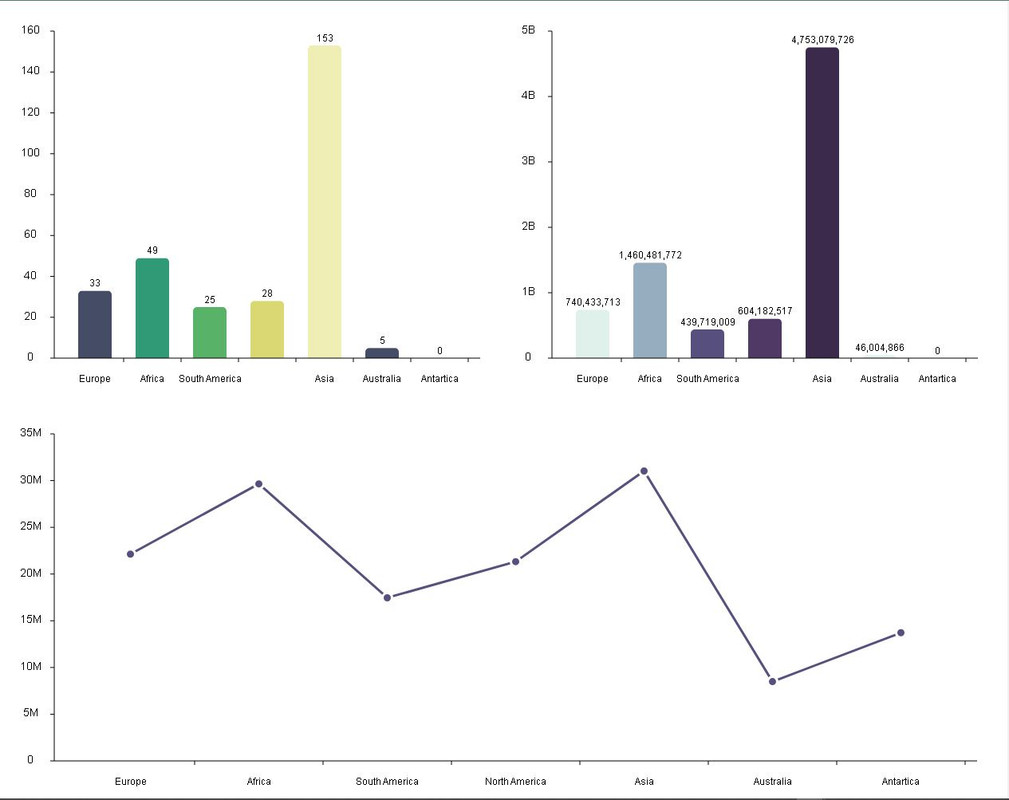
}Example
<template>
  <div>
    <div class="bar-charts">
      <vc-bar-chart
        :data-source="dataSource"
        argument-field="continent"
        value-field="density"
        :bar-colors="['#454d66', '#309975', '#58b368', '#dad873', '#efeeb4', '#454d66', '#309975']"
        :bar-radius="5"
        :animation="true"
        :custom-value-label="getValueLabel"
        show-value-labels
        @bar:click="onBarClick"
      />
      <vc-bar-chart
        :data-source="dataSource"
        argument-field="continent"
        value-field="population"
        :bar-colors="['#e0f0ea', '#95adbe', '#574f7d', '#503a65', '#3c2a4d', '#e0f0ea', '#95adbe']"
        :bar-radius="5"
        :animation="true"
        show-value-labels
        :custom-value-label="getValueLabel"
        @bar:click="onBarClick"
      />
    </div>
    <vc-line-chart
      :data-source="dataSource"
      argument-field="continent"
      value-field="area"
      line-color="#574f7d"
      :animation="true"
      :custom-value-label="getValueLabel"
      @point:click="onBarClick"
    />
  </div>
</template>

<script>
import { VcBarChart, VcLineChart } from 'vue-chartify'
export default {
  components: { VcBarChart, VcLineChart },
  data() {
    return {
      dataSource: [
        {
          continent: 'Europe',
          population: 740433713,
          area: 22134710,
          density: 33
        },
        {
          continent: 'Africa',
          population: 1460481772,
          area: 29648481,
          density: 49
        },
        {
          continent: 'South America',
          population: 439719009,
          area: 17461112,
          density: 25
        },
        {
          continent: 'North America',
          population: 604182517,
          area: 21330000,
          density: 28
        },
        {
          continent: 'Asia',
          population: 4753079726,
          area: 31033131,
          density: 153
        },
        {
          continent: 'Australia',
          population: 46004866,
          area: 8486460,
          density: 5
        },
        {
          continent: 'Antartica',
          population: 0,
          area: 13720000,
          density: 0
        }
      ]
    }
  },
  methods: {
    onBarClick(data) {
      console.log(data)
    },
    onPointClick(data) {
      console.log(data)
    },
    getValueLabel(value) {
      if (value > 0 && value < 1) {
        const precision = Math.ceil(-Math.log10(value))
        return value.toFixed(precision)
      }
      return value.toLocaleString()
    }
  }
}
</script>

<style lang="scss" scoped>
.bar-charts {
  display: flex;
  flex-direction: row;
}
</style>