unusedjs
v0.2.2
Published
Discover the percent of unused JS on a page with this simple browser proxy
Downloads
20
Maintainers
Readme
There are already several tools that tell you the percent of unused CSS on a webpage. But what about unused JS? Well this tool does it for JS.
It is a browser proxy written in NodeJS.
How does it work ?
- The proxy intercepts incoming javascript files.
- Each script is instrumented on the fly by a test coverage tool (Istanbul).
- When the script executes on the page, coverage metrics are collected in the background.
Be careful, the proxy is not working with HTTPS files.
JS files loaded over HTTPS are ignored. Proxies can't intercept SSL communication.
Installation
You need to open your console and write:
npm install unusedjs -gUse
Start the server by writing in your console:
unused-js-proxyConfigure your browser's proxy to
localhost:3838. Only set the HTTP proxy, let the HTTPS (=SSL) proxy empty.Clear your browser cache <== IMPORTANT
Open your browser's and wait until the page is fully loaded
Open your browser's console and write
_unusedjs.report()
Results
Results are displayed in the console:

Why "(for the moment)"? Because the score might change if some more JS gets executed in the page.
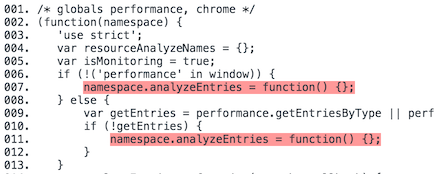
Inspect what code is unused for one file (experimental)
_unusedjs.file(<file number>)There are stille some bugs with very large files, especially when minified on one very long line. Best displayed on Chrome or Safari.

Troubleshooting / FAQ
_unusedjs is not defined
That means no JS file was instrumented by the proxy. Make sure the page you are testing is not HTTPS. Make sure the page loads at least 1 script and it's not over HTTPS. Make sure the proxy is still running and is not displaying errors. Then make sure you configured correctly your browser's proxy.
The proxy fails with an error
I did not debug this error yet. Can you?
The console doesn't display the colors
Your browser may not be compatible with console.log styling.
The page loads slower
Yes. The JS files are instrumented by the proxy and this step is slow. And it's not parallelized. Don't forget to kill the tool when you're done, otherwise you might experience a sloooooow surfing session.
Inlined scripts are not analyzed
Sorry.
Does XX% of unused code mean I should remove it?
It's not so easy. It can be some code that's not executed at page load, triggered by a user action for example. If it's a library (such as jQuery), removing the unused parts is pretty hazardous.
My trouble / question is not listed here
Just open a GitHub issue :)
What's next with this tool?
For the moment it's just a quick proof of concept. Tell me if the tool is interesting, because here are some ideas for the future:
- automatically make the measures on domContentLoaded, domContentLoadedEnd and domComplete (can help defer scripts after the critical path).
- automatic launch in PhantomJS configured with the proxy.
- a service worker that does this automatically (on localhost).
Author
Gaël Métais. I'm a webperf freelance. Follow me on Twitter @gaelmetais, I tweet mostly about Web Performances.
If you understand French, you can visit my website (will be soon in English too).
