
taiko-diagnostics
v0.4.0
Published
A plugin for taiko which provides some diagnostics features
Downloads
16,337

Readme
![]()


taiko-diagnostics
A plugin for taiko which provides some diagnostics features like measuring speedindex, performance metrics of webpage.
Installation
npm install taiko-diagnostics --save
Usage
import { openBrowser, goto, closeBrowser, diagnostics } from 'taiko';
const {
  startTracing,
  startCssTracing,
  stopCssTracing,
  endTracing,
  getSpeedIndex,
  getPerformanceMetrics
} = diagnostics;

jest.setTimeout(30000);
beforeEach(async () => {
  await openBrowser();
});

afterEach(async () => {
  await closeBrowser();
});

test('Should return speedindex and perceptualSpeedIndex', async () => {
  await startTracing();
  await goto('https://github.com/');
  await endTracing();
  const { speedIndex, perceptualSpeedIndex } = await getSpeedIndex();
  expect(speedIndex).toBeTruthy();
  expect(perceptualSpeedIndex).toBeTruthy();
});
startTracing() Command
Start tracing the browser. Tracing could be started only once per browser.
startTracing();endTracing Command
Stop tracing the browser.
endTracing();getTracingLogs Command
Returns the tracelogs that was captured within the tracing period. You can use this command to store the trace logs on the file system to analyse the trace via Chrome DevTools interface.
startTracing();
goto('https://github.com/');
endTracing();

fs.writeFileSync(
  '/path/to/tracelog.json',
  JSON.stringify(await getTracingLogs())
);
getSpeedIndex Command
Returns the Speed Index and Perceptual Speed Index from the page load that happened between the tracing period.
startTracing();
goto('https://github.com/');
endTracing();

console.log(getSpeedIndex());
// outputs
// { speedIndex: 789.6634800064564,
//   perceptualSpeedIndex: 876.0901860232523 }
getPerformanceMetrics Command
startTracing();
goto('https://github.com/');
endTracing();

console.log(getPerformanceMetrics());
// outputs
//{
//    firstPaint: 735.666,
//    firstContentfulPaint: 735.669,
//    firstMeaningfulPaint: 735.671,
//    domContentLoaded: 574.546,
//    timeToFirstInteractive: 735.671,
//    load: 1379.895
//    }
getCssCoverage Command
startCssTracing();
goto('https://unused-css-example-site-qijunirqpu.now.sh');
const cssCoverage = await stopCssTracing();
//[ { url: 'https://unused-css-example-site-qijunirqpu.now.sh/main.css',
//        type: 'CSS',
//        totalBytes: 1453,
//        usedBytesTotal: 653,
//        unusedBytesTotal: 800,
//       usedPercentage: 44.941500344115624,
//        unusedPercentage: 55.058499655884376 } ]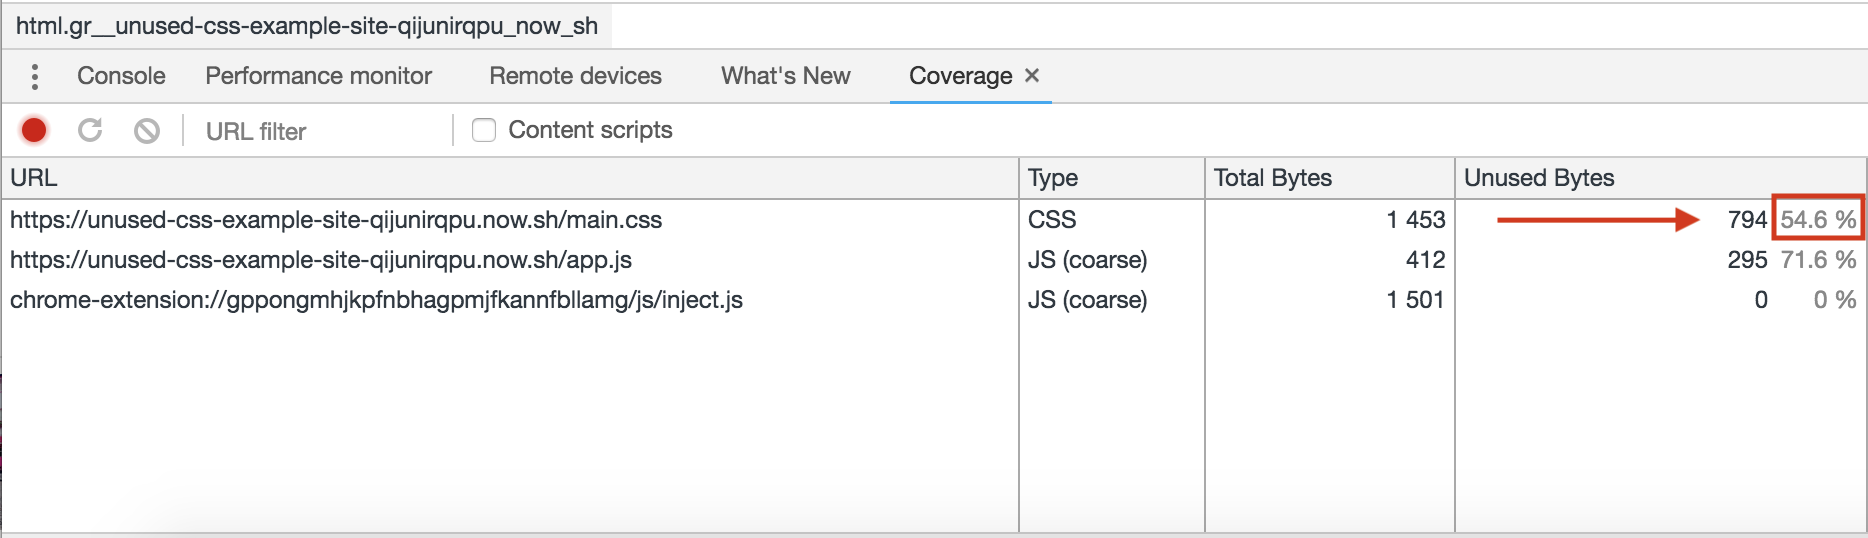
Pretty print cssCoverage in table
await prettyCSS(coverage);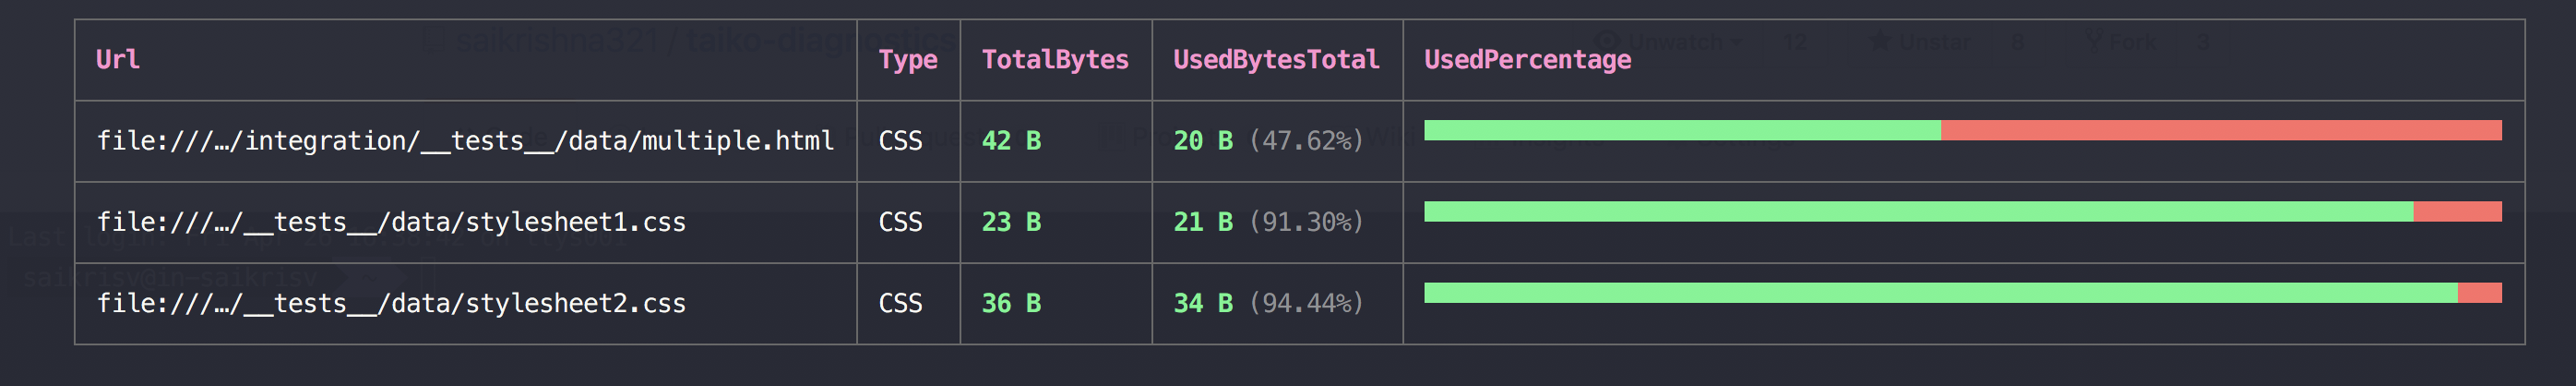
logConsoleInfo command
const error = [];
  let emitter = await logConsoleInfo();
  emitter.on('pageError', e => { // Other emitters - logEntry, consoleLog
    error.push(e);
  });

await goto('gauge.org/sdfsd');
Make sure not to add `await` as logConsoleInfo enables log Listener.

//{
//"source":"network",
//"level":"error",
//"text":"Failed to load resource: the server responded with a status of 404 ()",
//"timestamp":1553288625400,
//"url":"https://gauge.org/sdfsd",
//"networkRequestId":"D56332F8080344A2696C18D0771EC383"
//}
Use in Taiko REPL
To launch the REPL type taiko --plugin taiko-diagnostics in your favorite terminal application. This will launch the Taiko Prompt.
e.g
Version: 0.7.0 (Chromium:74.0.3723.0) Type .api for help and .exit to quit
You should now have full access to all of the diagnostics in the taiko REPL window
REPL example
> openBrowser()
 ✔ Browser opened
> startTracing()
 ✔ Browser tracing started
> goto('https://github.com/');
 ✔ Navigated to url "https://github.com/"
> endTracing();
 ✔ Browser tracing ended
> getSpeedIndex();
{ speedIndex: 30631.375729995667,
  perceptualSpeedIndex: 30634.177980202476 }
> getPerformanceMetrics();
info Detected renderer thread by 'TracingStartedInBrowser' event: pid 69317, tid 775
{ firstPaint: 834.819,
  firstContentfulPaint: 834.821,
  firstMeaningfulPaint: 997.381,
  domContentLoaded: 1073.878,
  timeToFirstInteractive: 1194.132,
  load: 1208.64 }
Note that startTracing,endTracing, and getSpeedIndex apis are not from taiko. These are given by the plugin.