npm package discovery and stats viewer.

Discover Tips

  • General search

    [free text search, go nuts!]

  • Package details

    pkg:[package-name]

  • User packages

    @[username]

Sponsor

Optimize Toolset

I’ve always been into building performant and accessible sites, but lately I’ve been taking it extremely seriously. So much so that I’ve been building a tool to help me optimize and monitor the sites that I build to make sure that I’m making an attempt to offer the best experience to those who visit them. If you’re into performant, accessible and SEO friendly sites, you might like it too! You can check it out at Optimize Toolset.

About

Hi, 👋, I’m Ryan Hefner  and I built this site for me, and you! The goal of this site was to provide an easy way for me to check the stats on my npm packages, both for prioritizing issues and updates, and to give me a little kick in the pants to keep up on stuff.

As I was building it, I realized that I was actually using the tool to build the tool, and figured I might as well put this out there and hopefully others will find it to be a fast and useful way to search and browse npm packages as I have.

If you’re interested in other things I’m working on, follow me on Twitter or check out the open source projects I’ve been publishing on GitHub.

I am also working on a Twitter bot for this site to tweet the most popular, newest, random packages from npm. Please follow that account now and it will start sending out packages soon–ish.

Open Software & Tools

This site wouldn’t be possible without the immense generosity and tireless efforts from the people who make contributions to the world and share their work via open source initiatives. Thank you 🙏

© 2024 – Pkg Stats / Ryan Hefner

react-svg-graphs

v2.1.12

Published

React SVG Graphs

Downloads

22

Readme

Build Status JavaScript Style Guide

react-svg-graphs

React SVG graphs is a library I wrote to render high-quality SVG graphs of scalar data. It is useful for things like metrics, but not statistics. Focus here is on specific use cases (e.g. temporal data), not to support a wide range of graphing requirements.

Status

This is being used in production since 1.6.x so you can consider it stable.

Installation

$ npm i react-svg-graphs

Requirements

You need to import Roboto Mono into your stylesheets somewhere, e.g.

<link href="https://fonts.googleapis.com/css?family=Roboto+Mono&display=swap" rel="stylesheet">

Features

4 types of graph are supported:

  1. Scalar data on a scalar X-axis.
  2. Scalar data over time.
  3. Aggregated scalar data over time (e.g. a graph showing HTTP 200 responses over time, a la Heroku metrics).
  4. Sparklines.

Limitations

  • If you want to display more than 10 sets of data you have to supply your own color palette.
  • No custom styling or configurations.

Testing

Running

$ npm run test:functional

will start a dev server and show the SVG outputs of different tests.

Usage:

The code in functional tests (see above) will show how to structure your data to generate graphs. The top-level components are:

<ScalarXScalarYGraph />
<TimeXScalarYGraph />
<TimeXAggregateYGraph />
<Sparkline />

For example:

import React from 'react'
import { render } from 'react-dom'

import { ScalarXScalarYGraph } from 'react-svg-graphs'
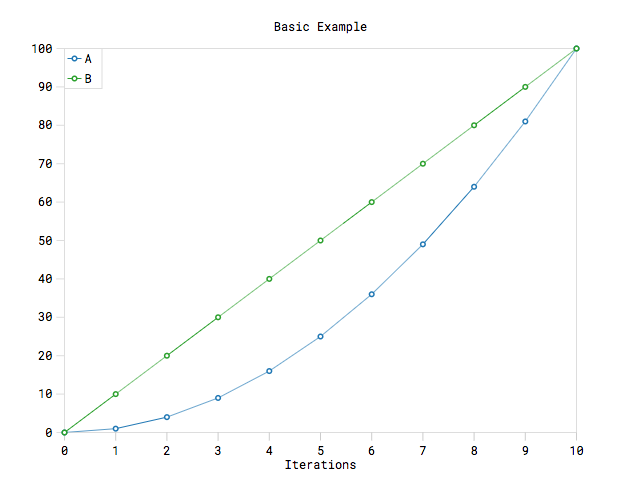
const data1 = [
  {
    label: 'A',
    values: [0, 1, 2, 3, 4, 5, 6, 7, 8, 9, 10].map(a => ({ x: a, y: a * a }))
  },
  {
    label: 'B',
    values: [0, 1, 2, 3, 4, 5, 6, 7, 8, 9, 10].map(b => ({ x: b, y: b * 10 }))
  }
]

render(
  <ScalarXScalarYGraph
    data={data1}
    width={width}
    height={height}
    title='Basic Example'
    xLabel='Iterations'
    onHover={hoverInfo => console.log('hover info:', hoverInfo)}
  />,
  document.getElementById('contents')
)

Result:

Basic Example