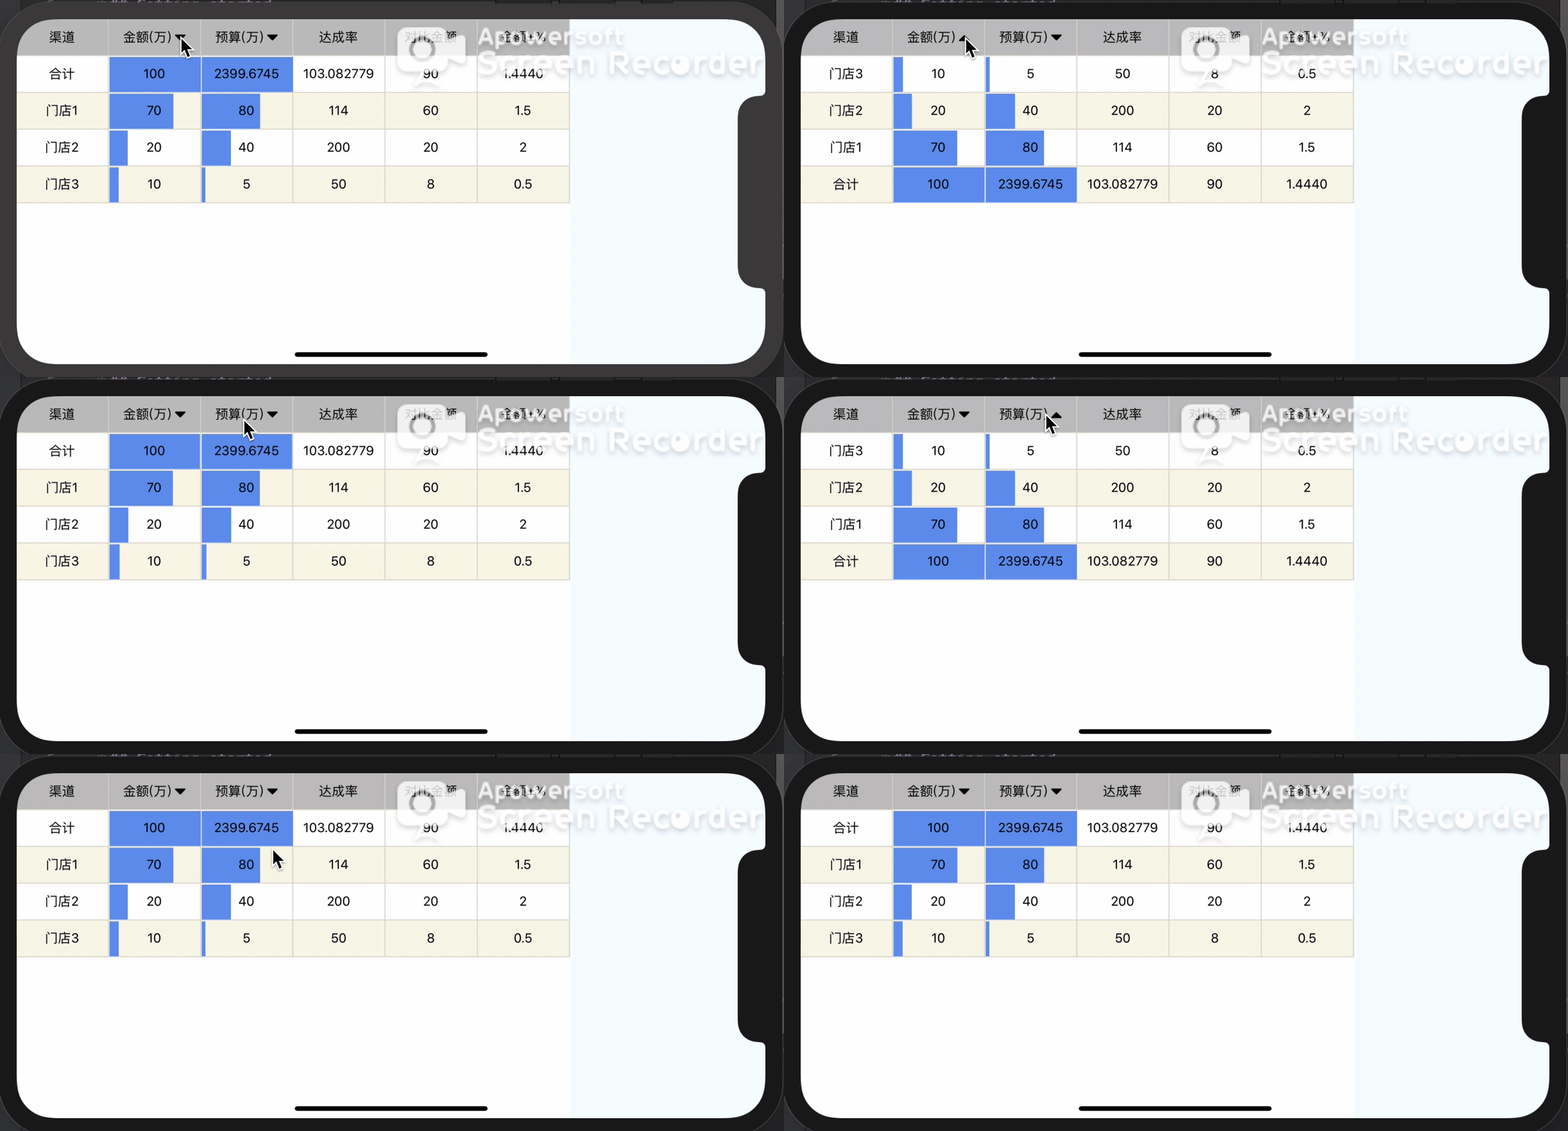
react-native-datatable-report
v1.0.9
Published
A ReactNative DataTable Component for android and iOS
Downloads
24
Maintainers
Readme
react-native-datatable

Getting started
$ npm install react-native-datatable-report --save
Mostly automatic installation
$ react-native link react-native-datatable-report
Manual installation
iOS
- In XCode, in the project navigator, right click
Libraries➜Add Files to [your project's name] - Go to
node_modules➜react-native-datatable-reportand addRNDatatable.xcodeproj - In XCode, in the project navigator, select your project. Add
libRNDatatable.ato your project'sBuild Phases➜Link Binary With Libraries - Run your project (
Cmd+R)<
Android
- Open up
android/app/src/main/java/[...]/MainActivity.java
- Add
import com.peng.datatable.RNDatatablePackage;to the imports at the top of the file - Add
new RNDatatablePackage()to the list returned by thegetPackages()method
- Append the following lines to
android/settings.gradle:include ':react-native-datatable-report' project(':react-native-datatable-report').projectDir = new File(rootProject.projectDir, '../node_modules/react-native-datatable-report/android') - Insert the following lines inside the dependencies block in
android/app/build.gradle:compile project(':react-native-datatable-report')
Usage
import DataTable from 'react-native-datatable-report';
    let tableDatas =[{
                dachenglv: "103.082779",
                fenqudao: "合计",
                huodanjia: "410.823618",
                jiaoyicishu: "41699",
                jinewan: "100",
                kedanjia: "593.215945",
                liandailv: "1.4440",
                shuliang: "90",
                yusuanwan: "2399.6745"
            },
                {
                    dachenglv: "114",
                    fenqudao: "门店1",
                    huodanjia: "332.635998",
                    jiaoyicishu: "1549",
                    jinewan: "70",
                    shuliang: "60",
                    liandailv: "1.5",
                    yusuanwan: "80"
                },
                {
                    dachenglv: "200",
                    fenqudao: "门店2",
                    huodanjia: "474.964759",
                    jiaoyicishu: "11654",
                    jinewan: "20",
                    shuliang: "20",
                    liandailv: "2",
                    yusuanwan: "40"
                },
                {
                    dachenglv: "50",
                    fenqudao: "门店3",
                    huodanjia: "434.252905",
                    jiaoyicishu: "9728",
                    jinewan: "10",
                    shuliang: "8",
                    liandailv: "0.5",
                    yusuanwan: "5"
                }];
    <DataTable
            leftKey='fenqudao' //表格最左侧的行头字段属性key [String]  [必传]
            head={[{name:"渠道"}, {name:"金额(万)",sort:"desc"}, {name:"预算(万)",sort:"desc"}, {name:"达成率"}, {name:"对比金额"}, {name:"金额±%"}]} //顶部表头数据  Array 格式举个🌰 [{name:'金额(万)',sort:'desc'},{name:'预算(万)'}]  name为表头显示名称;sort为排序方式,不传不排序  [数组] [必传]
            list={tableDatas} //表格数据 [Array]  [必传]
            dataKeys={['jinewan','yusuanwan','dachenglv','shuliang','liandailv']} //表格中需要展示的列属性key,依次按照先后顺序展示  [必传,不传默认显示全部]
            showProgressBarKeys={['jinewan','yusuanwan']}  //是否展示颜色比例,传入要显示的列名,这个字段有点冗余,应该放在head里面,后期设计放在一个字段中  [可选]
            unstatisticsRows={['合计']} //不需要统计某一行数据,传入行头 [数组] [可选]
            onClickItemCell={(item,row, column) =>{//点击右侧单元格的事件,事件回调返回行row,列column,以及点击内容 [function] [可选]
                //事件处理
                console.log(item,row,column);
            }}
            onClickHeadItemCell={(item,row, column) =>{//点击表头头部单元格的事件,事件回调返回行row,列column,以及点击内容 [function] [可选]
                //事件处理
                console.log(item,row,column);
            }}
            progressColor={'#a4b511'} //百分比的颜色值
       />
