react-gauge-component
v1.2.62
Published
Gauge component for React
Downloads
81,137
Maintainers
Readme
react-gauge-component
React Gauge Chart Component for data visualization.
This is forked from @Martin36/react-gauge-chart 0b24a45. Key differences:
Demo
https://antoniolago.github.io/react-gauge-component/
Usage
Install it by running npm install react-gauge-component --save or yarn add react-gauge-component. Then to use it:
import GaugeComponent from 'react-gauge-component';
//or
import { GaugeComponent } from 'react-gauge-component';

//Component with default values
<GaugeComponent />
For next.js you'll have to do dynamic import:
import dynamic from "next/dynamic";
const GaugeComponent = dynamic(() => import('react-gauge-component'), { ssr: false });

//Component with default values
<GaugeComponent />
Examples
Simple Gauge.
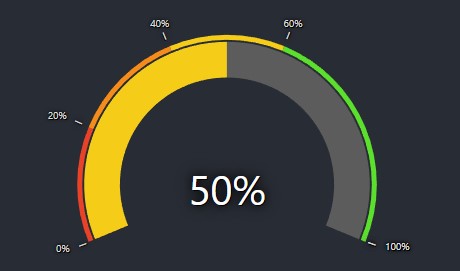
Simple Gauge
<GaugeComponent
  arc={{
    subArcs: [
      {
        limit: 20,
        color: '#EA4228',
        showTick: true
      },
      {
        limit: 40,
        color: '#F58B19',
        showTick: true
      },
      {
        limit: 60,
        color: '#F5CD19',
        showTick: true
      },
      {
        limit: 100,
        color: '#5BE12C',
        showTick: true
      },
    ]
  }}
  value={50}
/>
Custom Bandwidth Gauge.
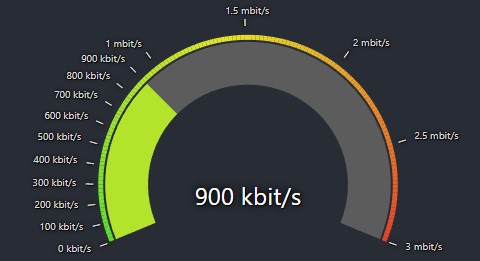
Bandwidth Gauge
const kbitsToMbits = (value) => {
  if (value >= 1000) {
    value = value / 1000;
    if (Number.isInteger(value)) {
      return value.toFixed(0) + ' mbit/s';
    } else {
      return value.toFixed(1) + ' mbit/s';
    }
  } else {
    return value.toFixed(0) + ' kbit/s';
  }
}
<GaugeComponent
  arc={{
    nbSubArcs: 150,
    colorArray: ['#5BE12C', '#F5CD19', '#EA4228'],
    width: 0.3,
    padding: 0.003
  }}
  labels={{
    valueLabel: {
      style: {fontSize: 40},
      formatTextValue: kbitsToMbits
    },
    tickLabels: {
      type: "outer",
      ticks: [
        { value: 100 },
        { value: 200 },
        { value: 300 },
        { value: 400 },
        { value: 500 },
        { value: 600 },
        { value: 700 },
        { value: 800 },
        { value: 900 },
        { value: 1000 },
        { value: 1500 },
        { value: 2000 },
        { value: 2500 },
        { value: 3000 },
      ],
      defaultTickValueConfig: {
        formatTextValue: kbitsToMbits
      }
    }
  }}
  value={900}
  maxValue={3000}
/>
Custom Temperature Gauge
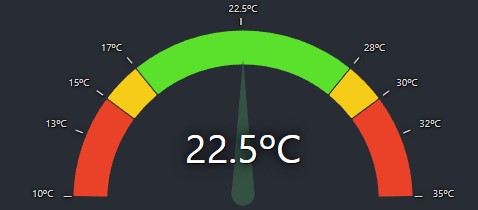
Temperature Gauge
<GaugeComponent
  type="semicircle"
  arc={{
    width: 0.2,
    padding: 0.005,
    cornerRadius: 1,
    // gradient: true,
    subArcs: [
      {
        limit: 15,
        color: '#EA4228',
        showTick: true,
        tooltip: {
          text: 'Too low temperature!'
        },
        onClick: () => console.log("AAAAAAAAAAAAAAAAAAAAAAAAAAAAAAAA"),
        onMouseMove: () => console.log("BBBBBBBBBBBBBBBBBBBBBBBBBBBBBBBB"),
        onMouseLeave: () => console.log("CCCCCCCCCCCCCCCCCCCCCCCCCCCCCCCC"),
      },
      {
        limit: 17,
        color: '#F5CD19',
        showTick: true,
        tooltip: {
          text: 'Low temperature!'
        }
      },
      {
        limit: 28,
        color: '#5BE12C',
        showTick: true,
        tooltip: {
          text: 'OK temperature!'
        }
      },
      {
        limit: 30, color: '#F5CD19', showTick: true,
        tooltip: {
          text: 'High temperature!'
        }
      },
      {
        color: '#EA4228',
        tooltip: {
          text: 'Too high temperature!'
        }
      }
    ]
  }}
  pointer={{
    color: '#345243',
    length: 0.80,
    width: 15,
    // elastic: true,
  }}
  labels={{
    valueLabel: { formatTextValue: value => value + 'ºC' },
    tickLabels: {
      type: 'outer',
      defaultTickValueConfig: {
        formatTextValue: (value: any) => value + 'ºC' ,
        style: {fontSize: 10}
    },
      ticks: [
        { value: 13 },
        { value: 22.5 },
        { value: 32 }
      ],
    }
  }}
  value={22.5}
  minValue={10}
  maxValue={35}
/>
Gauge with blob.
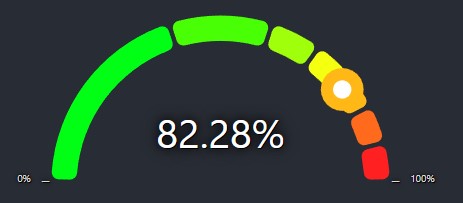
Custom gauge with blob
<GaugeComponent
  type="semicircle"
  arc={{
    colorArray: ['#00FF15', '#FF2121'],
    padding: 0.02,
    subArcs:
      [
        { limit: 40 },
        { limit: 60 },
        { limit: 70 },
        {},
        {},
        {},
        {}
      ]
  }}
  pointer={{type: "blob", animationDelay: 0 }}
  value={50}
/>
Gradient with arrow gauge.
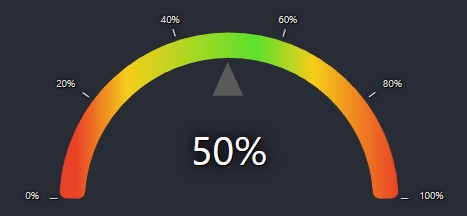
Custom gradient with arrow
<GaugeComponent
  id="gauge-component4"
  arc={{
    gradient: true,
    width: 0.15,
    padding: 0,
    subArcs: [
      {
        limit: 15,
        color: '#EA4228',
        showTick: true
      },
      {
        limit: 37,
        color: '#F5CD19',
        showTick: true
      },
      {
        limit: 58,
        color: '#5BE12C',
        showTick: true
      },
      {
        limit: 75,
        color: '#F5CD19',
        showTick: true
      },
      { color: '#EA4228' }
    ]
  }}
  value={50}
  pointer={{type: "arrow", elastic: true}}
/>
Custom radial gauge.
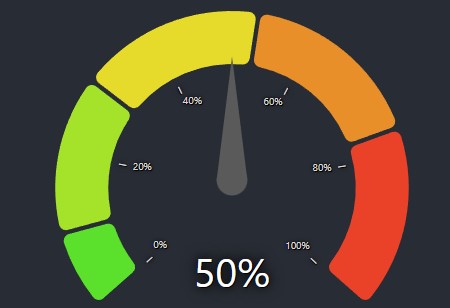
Custom Radial Gauge
<GaugeComponent
  value={50}
  type="radial"
  labels={{
    tickLabels: {
      type: "inner",
      ticks: [
        { value: 20 },
        { value: 40 },
        { value: 60 },
        { value: 80 },
        { value: 100 }
      ]
    }
  }}
  arc={{
    colorArray: ['#5BE12C','#EA4228'],
    subArcs: [{limit: 10}, {limit: 30}, {}, {}, {}],
    padding: 0.02,
    width: 0.3
  }}
  pointer={{
    elastic: true,
    animationDelay: 0
  }}
/>
API
Colors for the chart
The 'colorArray' prop could either be specified as an array of hex color values, such as ["#FF0000", "#00FF00", "#0000FF"] where
each arc would a color in the array (colors are assigned from left to right). If that is the case, then the length of the array
must match the number of levels in the arc.
If the number of colors does not match the number of levels, then the first and the last color from the colors array will
be selected and the arcs will get colors that are interpolated between those. The interpolation is done using d3.interpolateHsl.
