poi_test_component
v0.0.41
Published
A Custom Component for Vue project
Downloads
5
Readme
公共组件库使用文档
图表类
通用图表渲染组件
组件名: EchartTool

功能描述:
   1 提供通用的图表渲染方案,具备简单的默认配置内容
   2 更新图表内容时,可以自动刷新图表缓存
   3 展示区间变化时,自动调整表格宽度
   4 点击图表,触发回调函数

入参:
   1 resData: 图表渲染对象
      {
         id: 图表动态id配置
         data: echart配置对象,与官网配置参数一样
      }
   2 callback_click (Function): 点击图表,回调函数
template 配置示例
   <EchartTool :resData="chartOption" class="chartStyle" />
图片示例:

bar / line / pie 公共样式渲染组件
组件名: ChartRender

功能描述:
   1 提供丰富的公共图表配置方案,只需要传入数据对象,就可以渲染公共的图表样式
   2 更新图表内容时,可以自动刷新图表缓存
   3 展示区间变化时,自动调整表格宽度
   4 点击图表,触发回调函数
   5 提供下钻、返回操作
   6 支持 bar / line / pie 组件
   7 柱图、线图可选择滑块配置

入参:
   1 height: 图表展示高度设置(number, string - '300px/vh/rem')
   2 props(必传 - type、name、value、unit、title): 自定义配置参数
      {
         type: bar / line / pie
         name: 参数 ‘anaysisData’ 的 name 配置参数
         value: 参数 ‘anaysisData’ 的 value 配置参数
         unit: 单位配置
         title: legend、series 的名称配置
         colors: string - '#1F90FF'
         xAxisLengthMax: 是否展示滑块,设置滑块的默认展示长度
         tooltip: tooltip 自定义配置(与echart配置参数一致)
         grid: grid 自定义配置(与echart配置参数一致)
         yAxis: yAxis 自定义配置(与echart配置参数一致)
         xAxis: xAxis 自定义配置(与echart配置参数一致)
         series: series 自定义配置(与echart配置参数一致)
         legend: legend 自定义配置(与echart配置参数一致)
      }
   3 anaysisData(必传): 图表渲染数据源(注:value、name参数取决于props的设置参数)
      [
         { value: 222, name: '数据一' },
         { value: 223, name: '数据二' },
      ]
   4 isGoDown: 是否需要下钻,默认false
   5 callback (Function): 点击图表,回调函数
template 配置示例
   <ChartRender class="mt15" :height="300"
      :props="{
         type: 'line', name: 'label', value: 'value', title: 'Chart Tezt', unit: 't',
         colors: ['blue'],
         xAxisLengthMax: 6
      }"
      :anaysisData="anaysisData"
      :callback="callback"
   />
图片示例:

多轴图表(柱图、线图)公共样式渲染组件
组件名: MultiChartRender

功能描述:
   1 提供丰富的公共图表配置方案,只需要传入数据对象,就可以渲染公共的图表样式
   2 更新图表内容时,可以自动刷新图表缓存
   3 展示区间变化时,自动调整表格宽度
   4 点击图表,触发回调函数
   5 支持 bar / line 组件
   6 可选择滑块配置
   7 可隐藏y轴内容

入参:
   1 height: 图表展示高度设置(number, string - '300px/vh/rem')
   2 props(必传 - type、name、value、unit、title): 自定义配置参数
      {
         type: bar / line
         name: 参数 ‘anaysisData’ 的 name 配置参数
         value: 参数 ‘anaysisData’ 的 value 配置参数
         unit: 单位配置
         title: legend、series 的名称配置
         colors: string - '#1F90FF'
         xAxisLengthMax: 是否展示滑块,设置滑块的默认展示长度
         tooltip: tooltip 自定义配置(与echart配置参数一致)
         grid: grid 自定义配置(与echart配置参数一致)
         yAxis: yAxis 自定义配置(与echart配置参数一致)
         xAxis: xAxis 自定义配置(与echart配置参数一致)
         series: series 自定义配置(与echart配置参数一致)
         legend: legend 自定义配置(与echart配置参数一致)

         xAxis_unit: x轴坐标名称
         xAxixShowType: x轴展示方式('index' - 下标数值)
         multi_yAxis: 是否多y轴
         isTime(true): tooltip 默认展示类型,默认是时间类型;false 时,直接展示series配置的名称
         customValue (Function): 自定义 series-data 数据处理逻辑
      }
   3 anaysisData(必传): 图表渲染数据源(注:value、name参数取决于props的设置参数)
      [
         {
            desc: '数据一',
            unit: 'kWh',
            data: [
               { value: 222, name: '2020-10-01 10:00:00' },
               { value: 223, name: '2020-10-01 10:00:00' },
            ]
         }
      ]
   4 isHasY: 是否需要隐藏y轴,默认false
   5 callback (Function): 点击图表,回调函数
template 配置示例
   <MultiChartRender class="mt15" :height="300"
      :props="{ type: 'line', name: 'timestamp', value: 'value', xAxisLengthMax: 60 * 6, xAxis_unit: 'h', multi_yAxis: true, xAxixShowType: 'index', xAxis: xAxisLable }"
      :anaysisData="historyDataList"
   />
图片示例:

表格类
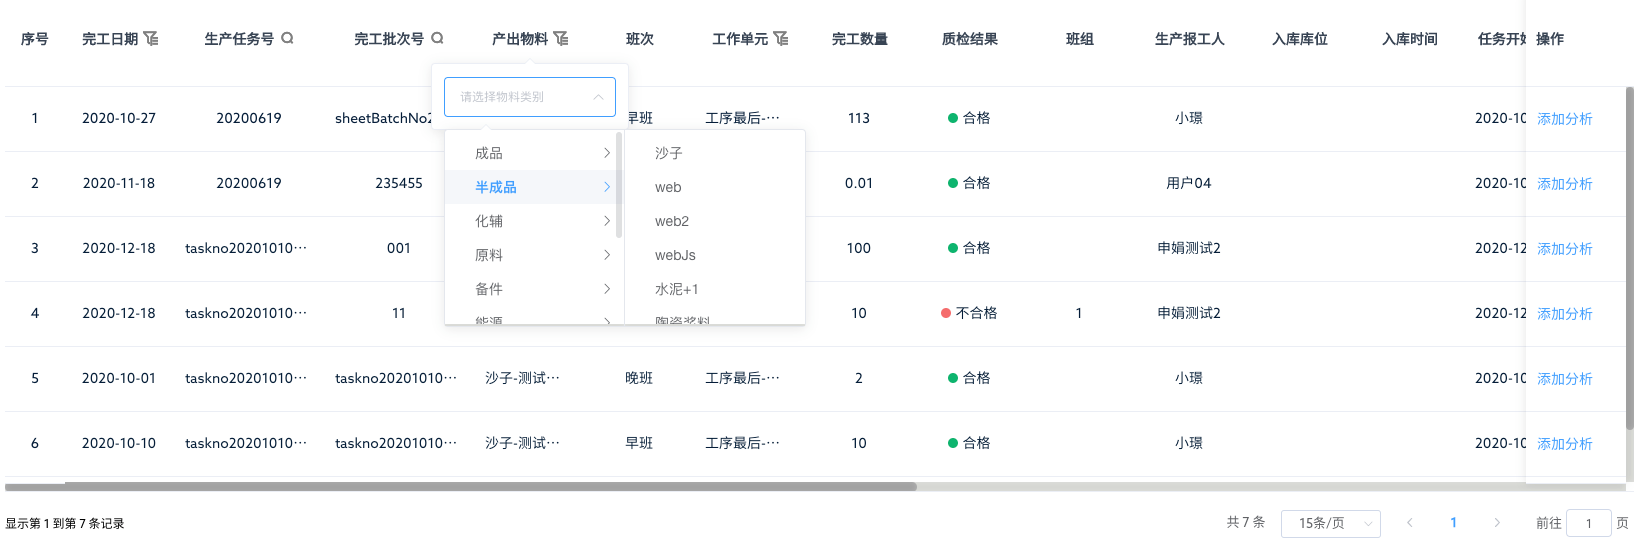
通用表格自定义配置组件
组件名: TableTemplateConfig

功能描述:
   1 全结构可自定义配置表格 - 可控制 'el-table' 的所有配置,通过 v-bind、v-on 方式配置
   2 表头、表体 都可以自定义插入展示内容和交互 - 通过 slot 方式插入
   3 表格头部、底部,可插入自定义内容 - 如表格底部插入页码
   4 配置有默认的表格样式

入参:
   1 formRef: ref 绑定el-table组件
   2 tableItem: (必传:tableData / optionItem)表格配置参数
      {
         tableData: [ // 数据源
            { finishDate: '2020-11-23', productNum: '2020-01-01-XM01', finishBatchNum: '0000001(0012)', outputName: '物料A', shift: '早班', factoryUnit: '1#水泥磨', finishNum: 1000, checkoutResult: 2 },
            { finishDate: '2020-11-24', productNum: '2020-01-01-XM02', finishBatchNum: '0000002(0012)', outputName: '物料B', shift: '早班', factoryUnit: '2#水泥磨', finishNum: 1000, checkoutResult: 1 },
         ],
         props: { // 参考 el-table 'Table Attributes'的配置, 通过 v-bind 写入 el-table
            'max-height': 300
         },
         event: { // 参考 el-table 'Table Events'的配置, 通过 v-on 写入 el-table)
            'select-all': () => {}
         },
         columnType: { // 表格是否需要 index(序号), selection(多选框)
            index: true, selection: false
         },
         optionItem: [ // 表格展示及 slot 插槽配置
            {
               required: 是否显示必填标示 *
               label: 表头名称
               prop: 内容对应type
               headerSlotName: 自定义表头项展示插槽
               slotName: 自定义表格内容项展示插槽

               ... // el-table 'Table-column Attributes'的配置参数,通过 v-bind 写入 el-table-column

               btnList: { text: 按钮文本, props: v-bind 参数, event: v-on 按钮事件 } 按钮列表
               columnType: 通用表单内容组件 ( Input / Select / Operation )
               formProps: 设置通用表单组件'columnType'时, 表单组件的参数配置 v-bind
               formEvent: 设置通用表单组件'columnType'时, 表单组件的
            },
            { label: '完工日期', prop: 'finishDate', headerSlotName: 'finishDate' },
            { label: '生产任务号', prop: 'productNum', headerSlotName: 'productNum', 'min-width': '150px' },
            { label: '完工数量', prop: 'finishNum' },
            { label: '质检结果', prop: 'checkResult', headerSlotName: 'checkResult', slotName: 'checkoutResult' },
            {
               label: "操作",
               align: "left",
               columnType: "Operation",
               fixed: "right",
               width: 100,
               btnList: [
                  {
                     text: "添加分析",
                     props: {
                        class: "web-point-edit",
                     },
                     event: ({row}: any) => ({
                        click: () => console.log({ row }),
                     }),
                  },
               ],
            },
         ],
      };
template 配置案例

      <TableTemplateConfig class="box mt15" :tableItem="tableItem" >
         <template slot="finishDate" slot-scope="{ data }">
            <el-popover placement="bottom" trigger="click">
               <el-date-picker
                  class="ml15 w250" unlink-panels :clearable="false" range-separator="~" type="daterange" start-placeholder="开始时间" end-placeholder="结束时间"
                  v-model="searchConfig.dateArr"
                  format="yyyy-MM-dd"
                  value-format="yyyy-MM-dd"
               />
               <div class="curror" slot="reference">
                  <span>{{ data.column.label }}</span>
                  <i class="iconfont poi-shaixuan fz14 ml5 normal_color" />
               </div>
            </el-popover>
         </template>

         <template slot="productNum" slot-scope="{ data }">
            <el-popover placement="bottom" trigger="click">
               <el-input v-model="searchConfig.keyword" />
               <div class="curror" slot="reference">
                  <span>{{ data.column.label }}</span>
                  <i class="iconfont poi-search fz16 ml5 normal_color" />
               </div>
            </el-popover>
         </template>

         <template slot="checkResult" slot-scope="{ data }">
            <el-popover placement="bottom" trigger="click">
               <el-select
                  v-model="searchConfig.checkResult"
                  class="mr15 w200px"
                  size="small"
               >
                  <el-option
                     v-for="key of Object.keys(resultConfig)"
                     :key="key"
                     :value="key"
                     :label="resultConfig[key]"
                  />
               </el-select>
               <div class="curror" slot="reference">
                  <span>{{ data.column.label }}</span>
                  <i class="iconfont poi-shaixuan fz14 ml5 normal_color" />
               </div>
            </el-popover>
         </template>
         <template slot="checkoutResult" slot-scope="{ data }">
            <span class="result" :class="{ 'red': data.row.checkoutResult === 1, 'green': data.row.checkoutResult === 2 } ">{{ resultConfig[data.row.checkoutResult] }}</span>
         </template>
      </TableTemplateConfig>
工具组件类
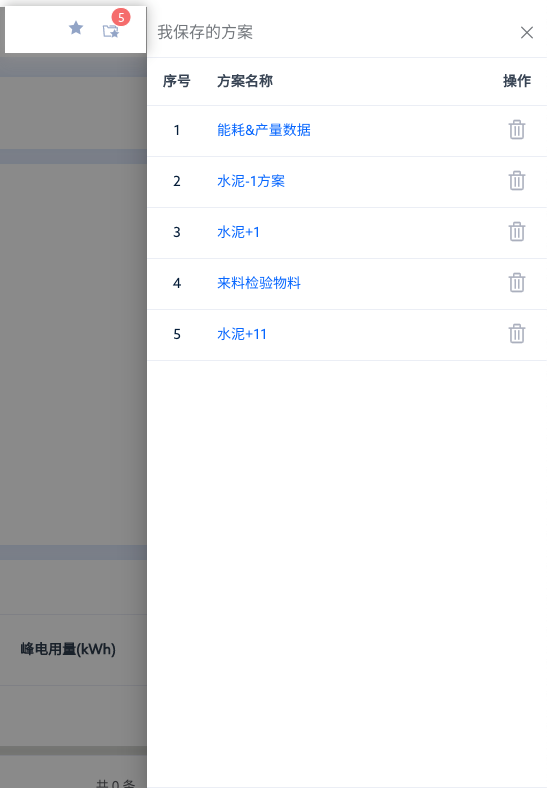
收藏夹组件
组件名: CollectCom

功能描述:
   1 通用收藏夹组件

入参:
   1 routerPath: 传入判定的路由
   2 showFirst: 初始化时,是否需要返回收藏的第一条数据
   3 pathName: 左侧路由名称展示
   4 schemeContent: 传入方案保存的内容
   5 init: 初始化传入参数
      {
         getRequest: Function,
         postRequest: Function,
         callback: Function, 点击方案是,回调选中数据
         API: Record<string, any> 调用组件的项目需要配置下面三个接口
            API.cloud.selectSchemeList
            API.cloud.addSchemes
            API.cloud.deleteSchemes
      }
组件调用案例
   template:
      <CollectCom pathName="无效生产分析" :schemeContent="schemeContent" :routerPath="$route.path" :init="collectInit" :showFirst="true" />

   data:
      private collectInit: Record<string, any> = {
         getRequest,
         postRequest,
         API,
         callback: this.callbackCollectCom,
      };

   methods:
      // 收藏夹回显 or 收藏夹新增
      private async callbackCollectCom({ type, content }: Record<string, any>) {
         // 'add' 类型直接调方案新增接口
         if (type === "add") {
            this.schemeContent = {};
            const headerConfig = (this.$refs.header as any).getParams();

            this.schemeContent = {
                  searchConfig: deepCopy({
                     reasonTreeId: this.reasonTreeId,
                     selectedReasonIds: this.selectedReasonIds,
                     headerConfig,
                  })
            };
            return;
         }

         const { searchConfig: { reasonTreeId, selectedReasonIds, headerConfig } } = content;
         this.reasonTreeId = reasonTreeId;
         this.selectedReasonIds = selectedReasonIds;
         !!this.$refs.header && (this.$refs.header as any).setSearchParams( headerConfig );
      }

范例演示
本地运行代码: yarn serve http://localhost:8901
本地演示代码路径:poi-component/src/examples/index.vue
