phaser-plugin-advanced-timing
v0.5.1
Published
Shows FPS, frame intervals, draw count, and other performance info
Downloads
227
Readme
Shows FPS, frame intervals, draw count, and other performance info. Demo
Usage
game.plugins.add(Phaser.Plugin.AdvancedTiming);
// or
game.plugins.add(Phaser.Plugin.AdvancedTiming, {mode: 'graph'});
The display modes are domMeter, domText, graph, meter, and text. The default mode is text.
You can save a reference to switch modes later:
var plugin = game.plugins.add(Phaser.Plugin.AdvancedTiming);
// …
plugin.mode = 'text';
The plugin also provides two debug methods:
game.debug.gameInfo(x, y);
game.debug.gameTimeInfo(x, y);
Beware that debug display can be slow in WebGL.
DOM Text, Text
plugin.mode = 'domText';
plugin.mode = 'text';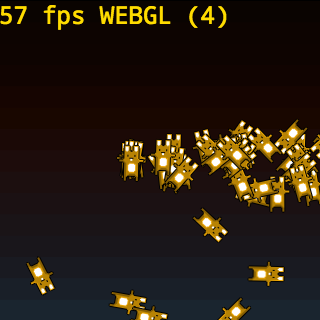
Both show FPS, render type, and WebGL draw count.
text is drawn on the game canvas. domText is a separate HTML element.
The domText element can be styled as
.ppat-text {
  position: absolute;
  left: 0;
  top: 0;
  margin: 0;
  font: 16px/1 monospace;
}
DOM Meter
plugin.mode = 'domMeter';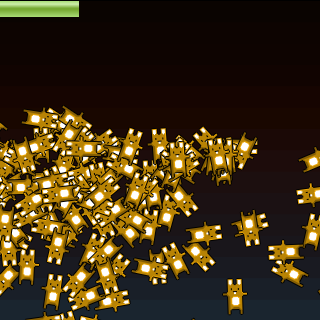
Shows FPS. It can be styled as
.ppat-fps {
  position: absolute;
  left: 0;
  top: 0;
}
Graph
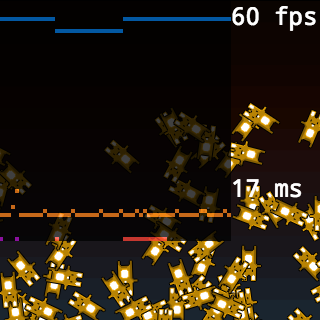
plugin.mode = 'graph';Plots values for the last 60 updates:
- FPS (blue)
- update duration (orange)
- render duration (violet)
- spiraling (red)
- updatesThisFrame (dark blue; only when forceSingleUpdate is off)
Meter
plugin.mode = 'meter';
Shows FPS (blue), update duration (orange), and render duration (violet).
Debug Methods
game.debug.gameInfo(x, y);
game.debug.gameTimeInfo(x, y);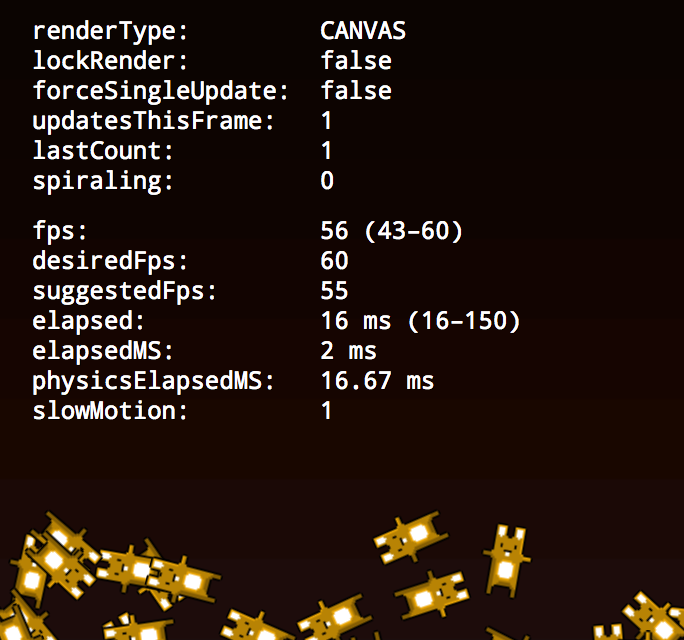
debug.gameInfo()
Prints values for
- game.forceSingleUpdate
game._lastCount: “how many ‘catch-up’ iterations were used on the logic update last frame”- game.lockRender
- game.renderType
game._spiraling: “if the ‘catch-up’ iterations are spiraling out of control, this counter is incremented”- game.updatesThisFrame: “number of logic updates expected to occur this render frame; will be 1 unless there are catch-ups required (and allowed)”
debug.gameTimeInfo()
Prints values for
- game.time.desiredFps
- game.time.elapsed (and min–max range)
- game.time.elapsedMS
- game.time.fps (and min–max range)
- game.time.physicsElapsedMS
- game.time.slowMotion
- game.time.suggestedFps
