
nativescript-performance-monitor
v1.0.0
Published
Measure and show FPS and (on iOS) CPU usage.
Downloads
7
Maintainers
 eddyverbruggen
Readme
NativeScript Performance Monitor
Measure and show FPS and (on iOS) CPU usage!
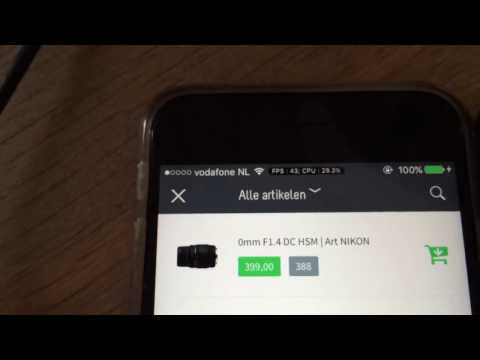
20 sec video, showing off the plugin on iOS and Android
Installation
From the command prompt go to your app's root folder and execute:
tns plugin add nativescript-performance-monitorStart monitoring
After adding the plugin you can start monitoring from code. There are a few options you can pass in as well (the options object itself is optional as well):
| Option | iOS? | Android? | Description
--- | --- | --- | ---
| onSample? | :white_check_mark: | :white_check_mark: | A callback function that gets invoked on every sample. If you don't want to use the default UI of this plugin you can use this to render your own UI. See the examples below for the function spec.
| hide? | :white_check_mark: | :white_check_mark: | Set to true if you don't want the default UI to show. So roll your own or go ito stealth mode entirely.
| textColor? | :white_check_mark: | :white_check_mark: | The text color of the monitor view (default white).
| backgroundColor? | :white_check_mark: | :white_medium_square: | Background color of the monitor view (default black).
| borderColor? | :white_check_mark: | :white_medium_square: | The border color of the monitor view (default black).
TypeScript
import { PerformanceMonitor, PerformanceMonitorSample } from 'nativescript-performance-monitor';
import { Color } from "color";

const performanceMonitor: PerformanceMonitor = new PerformanceMonitor();

// this would suffice..
performanceMonitor.start();

// .. but we want to show off the options ;)
performanceMonitor.start({
  textColor: new Color("white"),
  backgroundColor: new Color("black"),
  borderColor: new Color("black"),
  hide: false,
  onSample: (sample: PerformanceMonitorSample) => {
    console.log("FPS: " + sample.fps);
    if (sample.cpu) { // iOS only
      console.log("CPU %: " + sample.cpu);
    }
  }
});
JavaScript
var perfMon = require("nativescript-performance-monitor");
var color = require("color");

var performanceMonitor = new perfMon.PerformanceMonitor();

performanceMonitor.start({
  textColor: new color.Color("white"),
  backgroundColor: new color.Color("black"),
  borderColor: new color.Color("black"),
  hide: false,
  onSample: function (sample) {
    console.log("FPS: " + sample.fps);
    if (sample.cpu) { // iOS only
      console.log("CPU %: " + sample.cpu);
    }
  }
});
Stop monitoring
To stop receiving measurements and hide the monitor UI you can simply do this:
performanceMonitor.stop();Usage with Angular
In any component, or even app.module.ts add:
import { PerformanceMonitor } from "nativescript-performance-monitor";

export class MyComponent {
  // use the constructor, or OnInit, or trigger from a button, or whatever really
  constructor() {
    new PerformanceMonitor().start({
      // options
    });
  }
}
Known issues (Android)
- May crash when a Toast is shown on newer Android versions while you're using the default UI.
- UI will hide when app is pauzed / resumed.