my-chart-demo
v1.2.3
Published
``` yarn add my-chart-demo // npm install my-chart-demo --save ```
Downloads
11

Readme
my-chart-demo
tips: 个人兴趣做的插件,当前是非常基础的,仅仅个人测试demo。勿喷~
1. 安装
yarn add my-chart-demo // npm install my-chart-demo --save2. 字段
颜色主题类型
enum EThemeType {
  walden = 0,
  vintage = 5,
  westeros = 10,
  shine = 15,
  macarons = 20,
}
图表类型枚举
enum EChartType {
  MSLine = 0,  // 折线
  MSBar = 5,   // 柱状
}
图表数据类型枚举
enum EChartDataType {
  static = 0,  // 静态
  dynamic = 5,  // 动态
}
IChartData接口
  // 数据项id
  id: string;
 // 数据项名
  name: string;
  // 数据
  value: string;
| 字段名 | 字段类型 | 默认值 | 备注 |
| :--------------: | :-----------------: | :---------------: | :----------------------: |
| id | string | Guid.EMPTY | 表id |
| name | string | | 图表名 |
| themeType | EThemeType | EThemeType.walden | 颜色主题类型 |
| chartType | EChartType | EChartType.MSLine | 图表类型 |
| dataType | EChartDataType | | 数据类型,分为静态和动态 |
| categoryData | string | | 类目轴数据 |
| chartsData | Array<IChartData> | | 数据项数据 |
3. 传递参数
| 字段名 | 字段类型 | 备注 |
| :--------------: | :--------------------------: | :--------------------: |
| width | number\| string\|undefined | 图表的宽度 |
| height | number\|string\|undefined | 图表的高度 |
| charts | IChart | 图表的数据 |
| idName | string | 图表的类名 |
| devicePixelRatio | number\|undefined | 设备像素比 |
| renderer | string\|undefined | 渲染方式 canvas| svg |
4. 例子
main文件引入
import MSChart from "my-chart-demo";
Vue.use(MSChart);
测试组件 测试数据在项目中
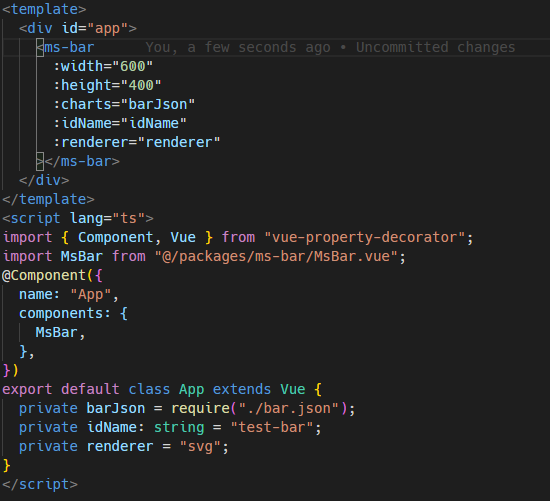
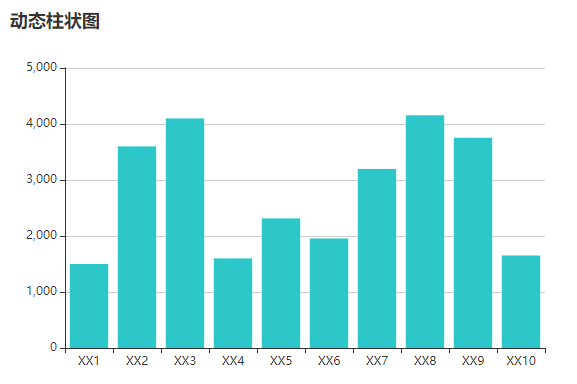
生成图表: