mojito-debug
v0.0.32
Published
mojito-debug helps developers debug their applications through debug hooks, whose results are shown on the client-side under the application when the 'debug' parameter appears in the URL.
Downloads
118
Keywords
Readme
mojito-debug 
mojito-debug is an npm package that helps developers debug the client/server sides of their Mojito applications through user-defined debug hooks. These hooks are enabled when a debug parameter appears in the url, and the results are displayed on the client-side below the application.
Table of contents
Screenshot
Getting Started
Install mojito-debug in the mojito application:
$ npm install mojito-debugAdd the debugger middleware to
application.json.[{ "settings": ["master"], ... "middleware": [ "./node_modules/mojito-debug/middleware/mojito-debug.js" ], ... }]Access the debugger by appending the
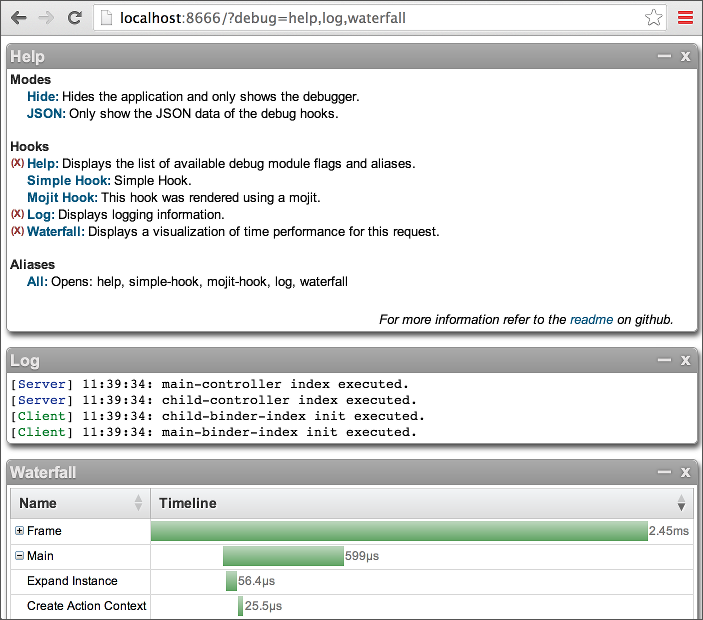
debugparameter to the url. For example: http://localhost/?debugThis loads the application with a help menu below. This help menu summarizes all the different debug modes, hooks, and aliases of hooks. Clicking any of these will automatically update the url and refresh the application and debugger.
To manually specify debug hooks, set the value of the debug parameter to a comma-separated list of debug hooks.
Debug Modes
The debugger has three modes: default, hide, and json. Each of these modes are represented by a particular debug parameter:
- debug - The default mode. Displays the application followed by the debugger.
- debug.hide - Hides the application and just shows the debugger.
- debug.json - Loads a page of content-type 'application/json', that displays all the debug hooks' data as JSON.
Debugging
Debugging involves instrumenting server/client side code with debugger API calls (debug hooks). When the debugger is disabled these hooks are empty functions, therefore the debugger presents no overhead when disabled. When the debugger is enabled, only the debug hooks specified in the debug parameter are enabled.
Simple Debug Hook
The simplest debug hook, requires no configuration, and involves directly specifying the content to be displayed. This is accomplished by calling ac.debug.setContent, passing a second argument that is a string or an object instead of a callback function. This is the equivalent of calling ac.debug.on and setting debugData._content to the content.
// Display HTML.
ac.debug.on('hook1', '<b>Value</b> = ' + value);

// Display JSON object.
ac.debug.on('hook2', jsonObject);
Configuration
Debug hooks can have a custom title and description, which is displayed in the help menu and on the hook's container. Mojit debug hooks, described below, require at least a base or type representing the mojit to be used to render the hook. Other options include standard mojit specs such as config and params. These configuration go under specs.debug.hooks.hook-name in application.json.
The configuration also accepts aliases, representing groups of debug hooks. Aliases are arrays of debug hooks and go under specs.debug.aliases.alias-name.
Example
"specs": {
    ...
    "debug": {
        "hooks": {
            "simple-hook": {
                "title": "Simple Hook",
                "description": "This is a simple debug hook that doesn't require a mojit to be rendered."
            },
            "mojit-hook": {
                "title": "Mojit Hook",
                "description": "This debug hook is rendered by the 'MojitHook' mojit.",
                "type": "MojitHook"
            }
        },
        "aliases": {
            "my-hooks": [
                "simple-hook",
                "mojit-hook"
            ]
        }
    },
    ...
}
Mojit Debug Hook
More complex debug hooks can be rendered using a mojit. During rendering these mojits can access the associated hook's debugData through ac.params.body('debugData'). The hook's name can be obtained from ac.params.body('hook').
Example
YUI.add('MojitHookController', function (Y, NAME) {
    Y.namespace('mojito.controllers')[NAME] = {
        index: function (ac) {
            var myData = ac.params.body('debugData').myData,
                hook = ac.params.body('hook');
            ac.done({
                hook: hook,
                myData: myData
            });
        }
    };
});
Client Side Debugging
After the application finishes execution on the server-side, the debugger displays the application in an iframe on the client-side. Once displayed, client-side YUI modules that require mojito-debug-addon have access to the debugger through ac.debug and its equivalent Y.Debug.
Debugging works just as in the server-side, except that client-side hooks have access to the same debugData used by corresponding server-side hooks; this allows client-side hooks to augment server-side debugging data. In addition the debug hooks data remain consistent regardless of instrumentation occurring in the client/server sides through tunnel requests and ajax calls.
Since the client-side has no end point, the debugger must be informed whenever hooks, getting data through ac.debug.on, are ready for rendering. This is done by calling ac.debug.render.
Example
ac.debug.on('mojit-hook-name', function (debugData) {
    debugData.myData = myData;
});
ac.dubug.render('mojit-hook-name');
Calling ac.debug.on or ac.debug.log, immediately updates the debugger and so doesn't require explicit calls to ac.debug.render.
Logs generated on the client-side are appended to any logs generated on the server-side. Rendered client-side debug hooks replace any corresponding server-side debug hooks. Alternatively, client-side hooks can augment server-side hooks by accessing the associated binder if it exists, using ac.debug.get.
Example
ac.debug.on('hook', function (debugData) {
    var binder = ac.debug.get('hook-name').binder;
    binder.update(debugData.clientSideData);
});
Waterfall - Performance Visualization
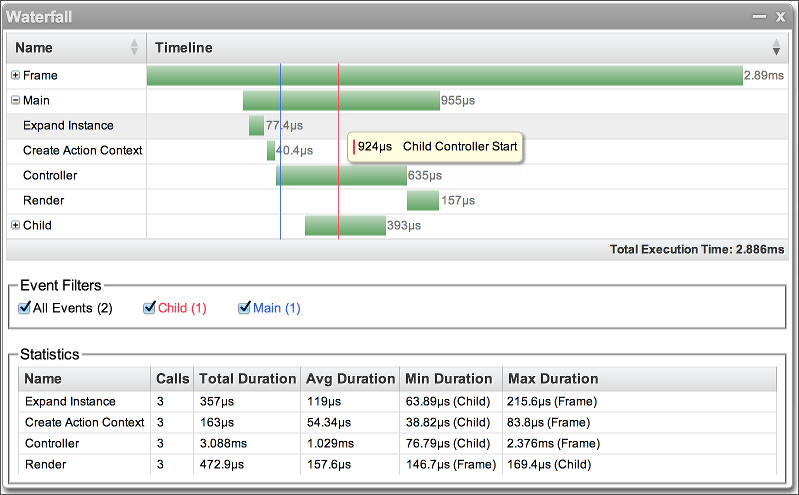
The debugger by default provides a debug hook called 'waterfall' which instruments key parts of Mojito's internals in order to present a visualization of mojit execution and statistical information. It makes use of mojito-waterfall's API to collect the timing data and renders the visualization using the package's Waterfall mojit.
Augmenting the Waterfall
Without any user instrumentation, the waterfall hook provides mojito level instrumentation of mojit execution that includes instance expansion, action context construction, controller execution, and rendering. The waterfall can be augmented by using the hook's debugData.waterfall Waterfall instance (take a look at the Waterfall API).
Example
ac.debug.on('waterfall', function (debugData) {
    var waterfall = debugData.waterfall;
    waterfall.start('Test');
    waterfall.event('Event 1');
    waterfall.end('Test');
});
API
ac.debug.on (hook, callback)
Gives access to the debugData object of an enabled hook.
- hook
string- The name of the hook. - callback
function- The function that is called if the specified hook is enabled. The function passes one argument,debugData, an object unique to the specified hook. This object is used to store any debugging data and is passed in subsequent calls toac.debug.onfor the specified hook.
Example
ac.debug.on('hook-name', function (debugData) {
    debugData.myData = myData;
});
ac.debug.setContent (hook, content)
Set the content of a hook to an HTML string or a JSON object. This is the equivalent of setting debugData._content to content.
- hook
string- The name of the hook. - content
string|object- The content to be displayed. Can be an HTML string or a JSON object.
Example
ac.debug.setContent('hook-name', content);ac.debug.appendTo (hook, content)
Append new a HTML string or JSON object to the current content of the hook. This is the equivalent of pushing content to the debugData._append array.
- hook
string- The name of the hook. - content
string|object- The content to be appended. Can be an HTML string or a JSON object.
Example
ac.debug.appendTo('hook-name', content);ac.debug.log (line, [options])
Logs an HTML line or a JSON object. Lines are shown by the log hook whenever enabled.
- line
string|object- The line to log. This line can be an HTML string or a JSON object. - options
string|objectoptional- Options include the stringserrorandwarnor a JSONTree options object (see JSONTree documentation).
Example
ac.debug.log('An error occurred:', 'error');
ac.debug.log(errorObject);
ac.debug.get (hook) Gets all the data associated with a debug hook.
- hook
string- The name of the hook. - returns
object- The data associated with the hook, this is the same as any configuration specified for this hook plusdebugData, the object used to store debugging data. On the client-side, this object also includesbinder, a reference to any associated hook binder, andhookContainer, the HookContainer instance representing the hook on the page (See HookContainer).
Example
var hookData = ac.debug.get('hook-name');ac.debug.error (hook, error, type) Shows an error on the rendered debug hook.
- hook
string- The name of the hook. - error
string|object- The error to display for this hook. As an object it can include a stringmessage, the error message; or an exception object, which is appended to themessageand whose stack is shown when the user mouses over the error. - type
objectoptional- The type of error. Can be 'error', 'warning' or any other defined css class.
Example
ac.debug.error('hook-name', {
    message: 'There was an exception'
    exception: e
});
ac.debug.clear (hook, whitelist) Clears the debugData for the specified hook. It may be useful to clear debugging data after using it, to prevent it from being serialized between the server/client sides. This is especially important if the data is very large or contains cycles.
- hook
string- The name of the hook. - whitelist
arrayoptional- A list of properties to keep. The rest of the properties in debugData are deleted.
Example
ac.debug.clear('hook-name', [
    'required-property'
]);
ac.debug.render ([hooks], [callback]) client-side only
On the server-side, hooks get rendered automatically after the application is rendered; however, on the client-side there is no end point, and so the debugger must be told when to render any debugging data resulting from client-side debug hooks that used ac.debug.on.
- hooks
string|string[]optional- A hook or list of hooks to render. If nothing is specified, then all hooks that calledac.debug.onare rendered. - callback
functionoptional- An optional callback that is called once all the hooks have been rendered. It passes one argument, hooks, a map of hooks and their corresponding data (the same data that is returned byac.debug.get). This callback can be passed as the only argument.
Example
ac.debug.render(['hook1', 'hook2'], function (hooks) {
    console.log(Object.keys(hooks).join(', ') + ' have finished rendering');
});Y.Debug.* client-side only
On the client side, ac.debug can conveniently be accessed through Y.Debug within any YUI module that includes mojito-debug-addon.


