
metricboard
v1.9.0
Published
MetricBoard is a performance monitoring tool that logs and visualizes microservice metrics with detailed charts for response times, status codes, and API performance
Downloads
26
Maintainers
 sanchit496
Keywords
Readme
MetricBoard: API Metrics Logging and Chart Visualization Middleware
Overview
MetricBoard is a middleware designed for Express.js applications to automatically log, analyze, and generate visual reports of HTTP request and response metrics. It provides detailed logging of critical performance indicators, such as response times, payload sizes, and status codes for every API call, saving them into JSON files and producing an HTML-based visual report with charts. MetricBoard is particularly useful for developers looking to monitor, analyze, and improve their microservices' performance through structured data and easily interpretable visualizations.
Key Features
Request and Response Logging:
- Logs every HTTP request's method, URL, status code, request size, response size, and response time.
- Organizes logs by microservice, creating a separate log for each service.
Auto-Generated HTML Reports:
- Generates detailed reports for each microservice using EJS templates.
- Provides clear visualizations with pie charts for request method distribution and status code distribution.
- Displays response time metrics and allows easy filtering of logs based on HTTP methods and status codes.
Endpoint-Specific Reports:
- Automatically generates specific reports for individual API endpoints, helping you pinpoint performance issues.
Visual Charts:
- Pie Charts for API request method distribution and status code distribution.
- Line Charts for requests over time to monitor traffic patterns across hours of the day.
Easy Integration:
- Works seamlessly with Express applications.
- Configurable to work with monitoring tools like
nodemonandpm2to avoid unnecessary restarts due to log file updates.
Installation
To install MetricBoard as a dependency in your project, run:
npm install metricboardUsage
To use MetricBoard in your Express application, follow these steps:
- Require the Middleware:
You can now attach the metricboard middleware to your Express app. When setting up the middleware, you need to specify two parameters:
a) baseUrl: The base URL for the routes you want the middleware to monitor.
b) microservices: An array of microservice names or resource paths you want to log metrics for
const express = require('express');
const { metricboard } = require('metricboard');
const app = express();

// Middleware for /app with microservices 'appuse' and 'contracts'
app.use(metricboard('/app', ['appuse', 'contracts']));

// Your application routes
app.get('/', (req, res) => res.send('Hello World!'));

app.listen(3000, () => console.log('Server running on port 3000'));
Nodemon Configuration:
Since MetricBoard generates files like
metrics.jsonandreport.html, you should configurenodemonto ignore these files to avoid unnecessary restarts:Add this section to your
package.json:"nodemonConfig": { "ignore": ["metrics/**/*.json", "metrics/**/*.html"], "verbose": true }PM2 Configuration:
For
pm2, add the following to yourecosystem.config.jsor a similar configuration file:{ "apps": [ { "name": "my-app", "script": "index.js", "ignore_watch": ["metrics"] } ] }
Generated Files and Structure
MetricBoard automatically creates a metrics directory in the root of your project where it stores logs and reports for each microservice.
File Structure
project-root/
│
├── metrics/
│   ├── microservice1/
│   │   ├── metrics.json    # Logs each API request in JSON format
│   │   └── report.html     # Visual HTML report with charts and metrics
│   ├── microservice2/
│   │   ├── metrics.json
│   │   └── report.html
JSON Metrics File
For each microservice, a metrics.json file is generated and updated for every API request. This file includes detailed logs of each request such as:
{
  "timestamp": "2024-09-15T12:45:30.123Z",
  "method": "GET",
  "url": "/api/users",
  "statusCode": 200,
  "reqSize": 256,
  "resSize": 1024,
  "responseTime": 134,
  "queryParams": {},
  "urlParams": {},
  "payload": {}
}
HTML Report
An HTML report is automatically generated for each microservice. This report includes:
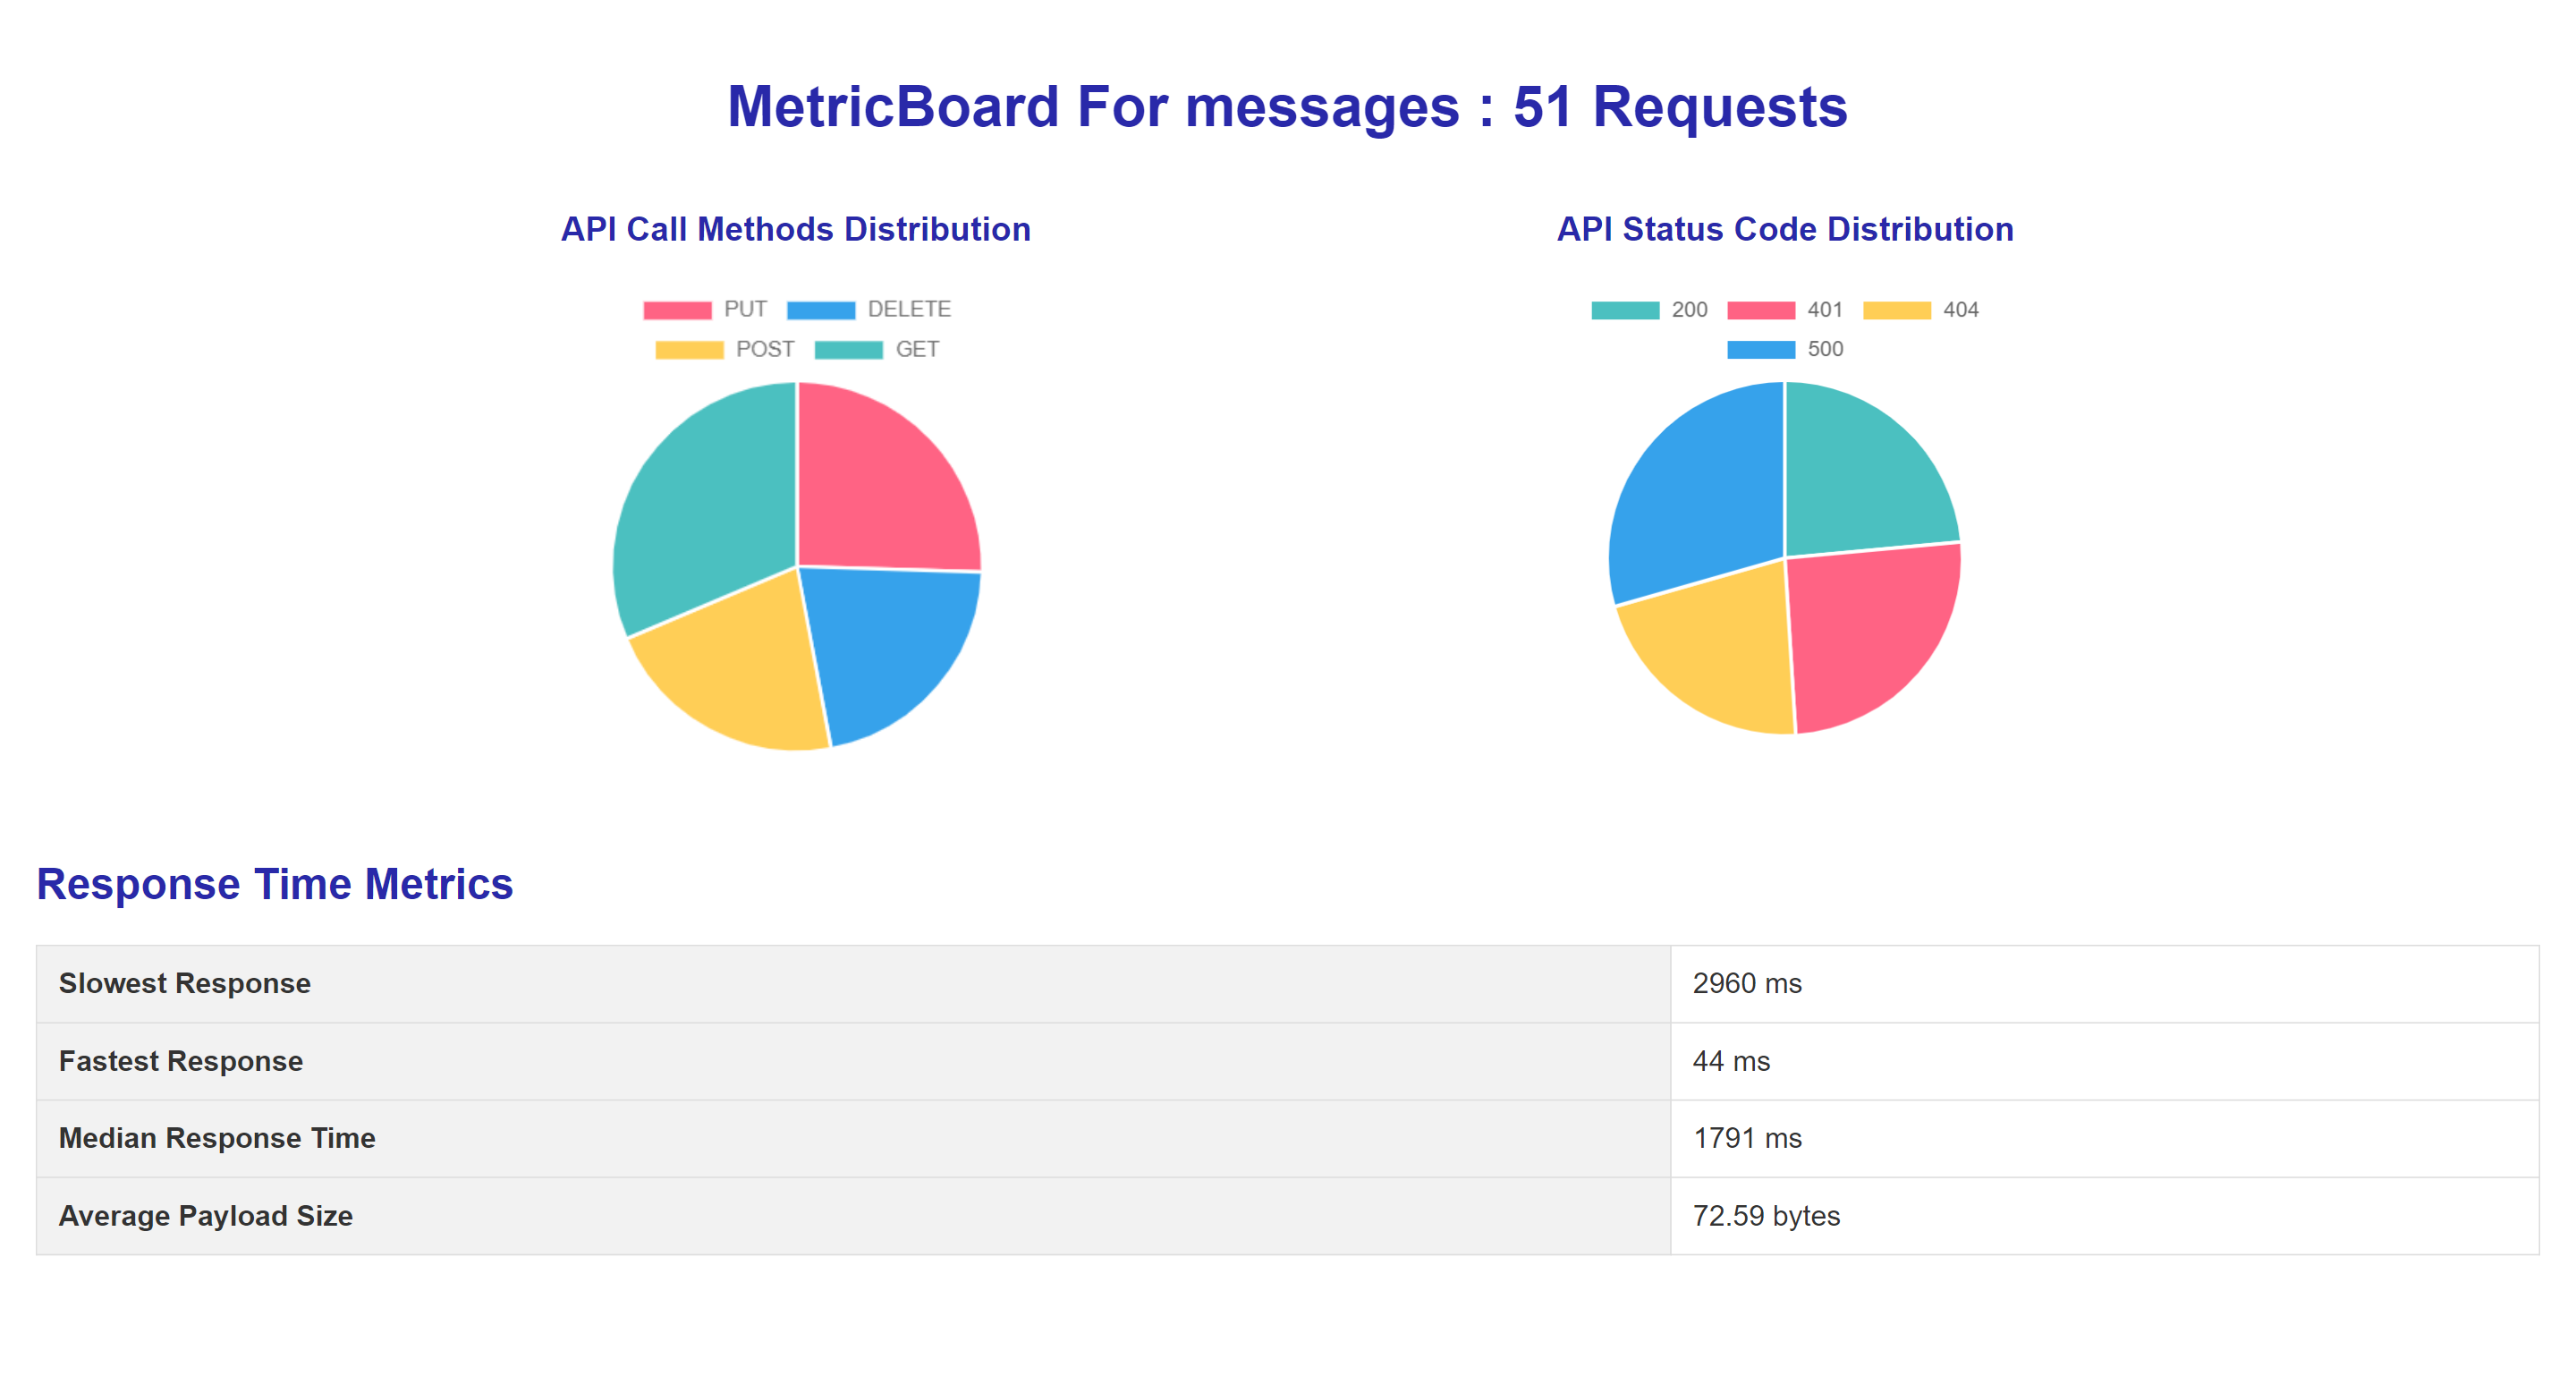
Request Method Distribution (Pie Chart): A chart displaying the proportion of requests made with each HTTP method (GET, POST, etc).
Status Code Distribution (Pie Chart): A breakdown of response status codes (e.g., 200, 401, 404, 500, etc) in a pie chart format.
Response Time Metrics: Key response time metrics such as:
- Slowest response
- Fastest response
- Median response time
- Average payload size
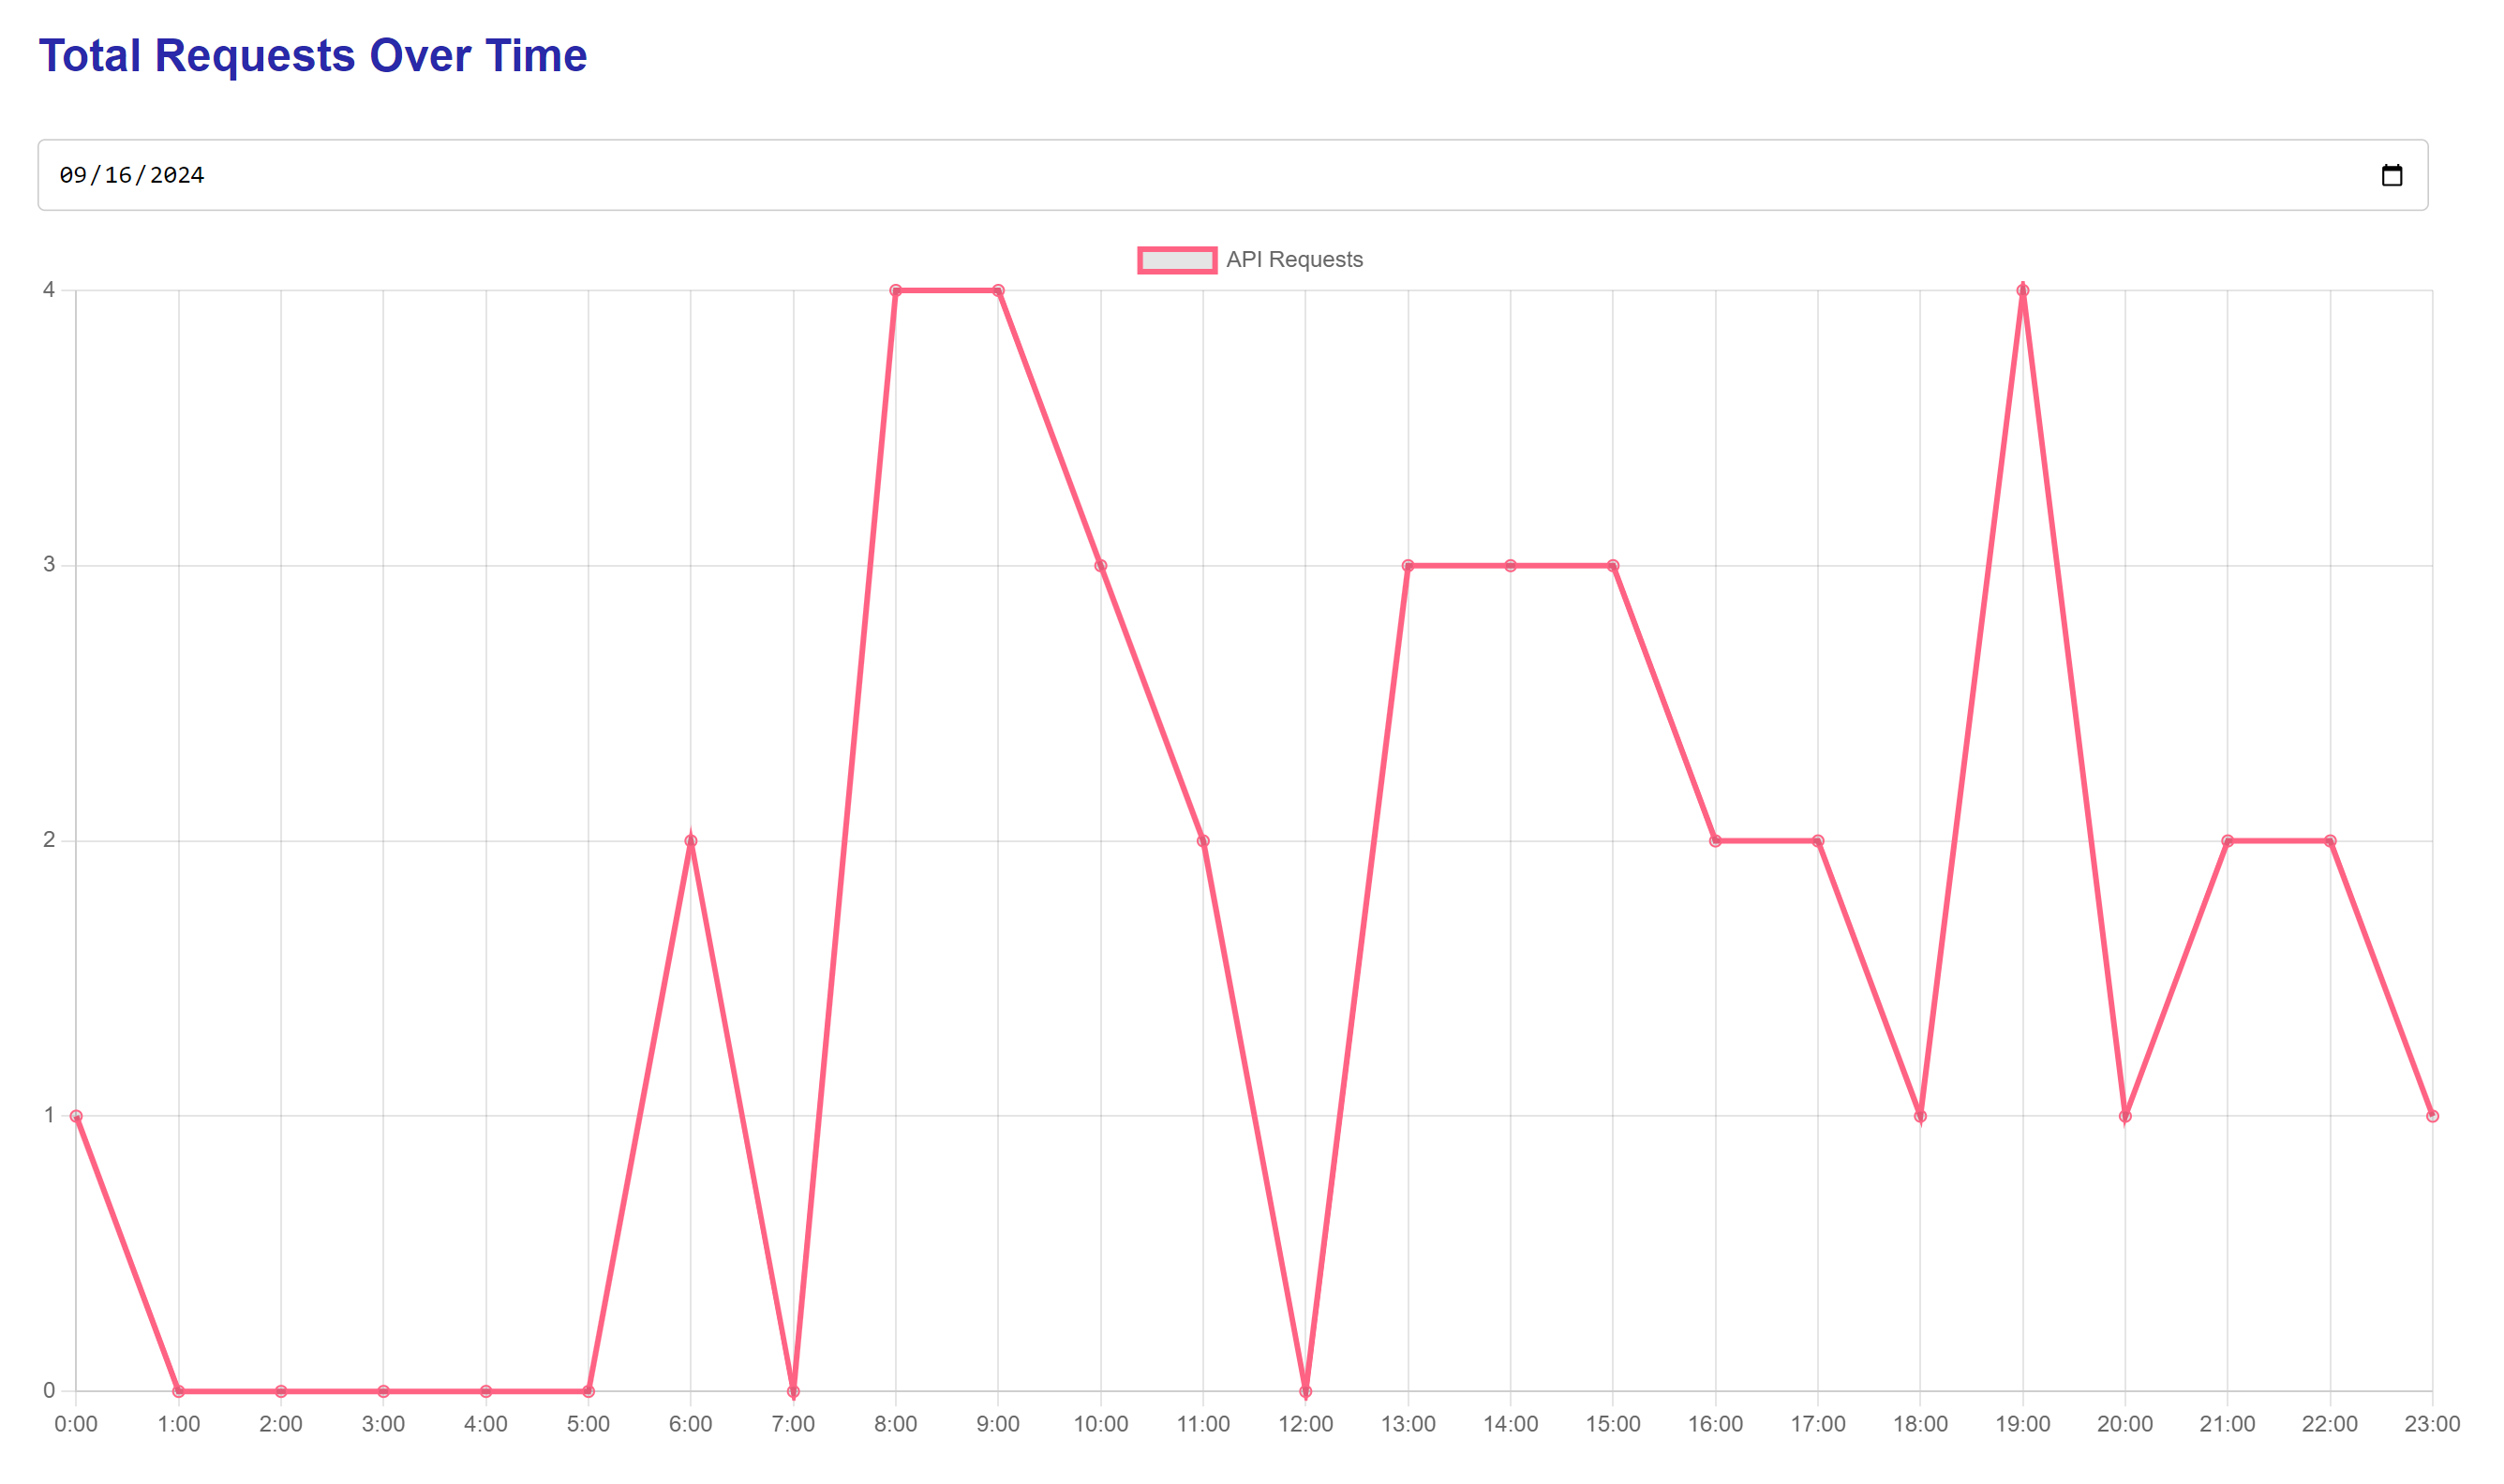
Requests Over Time (Line Chart): A line chart showing the number of requests made at each hour of the day.
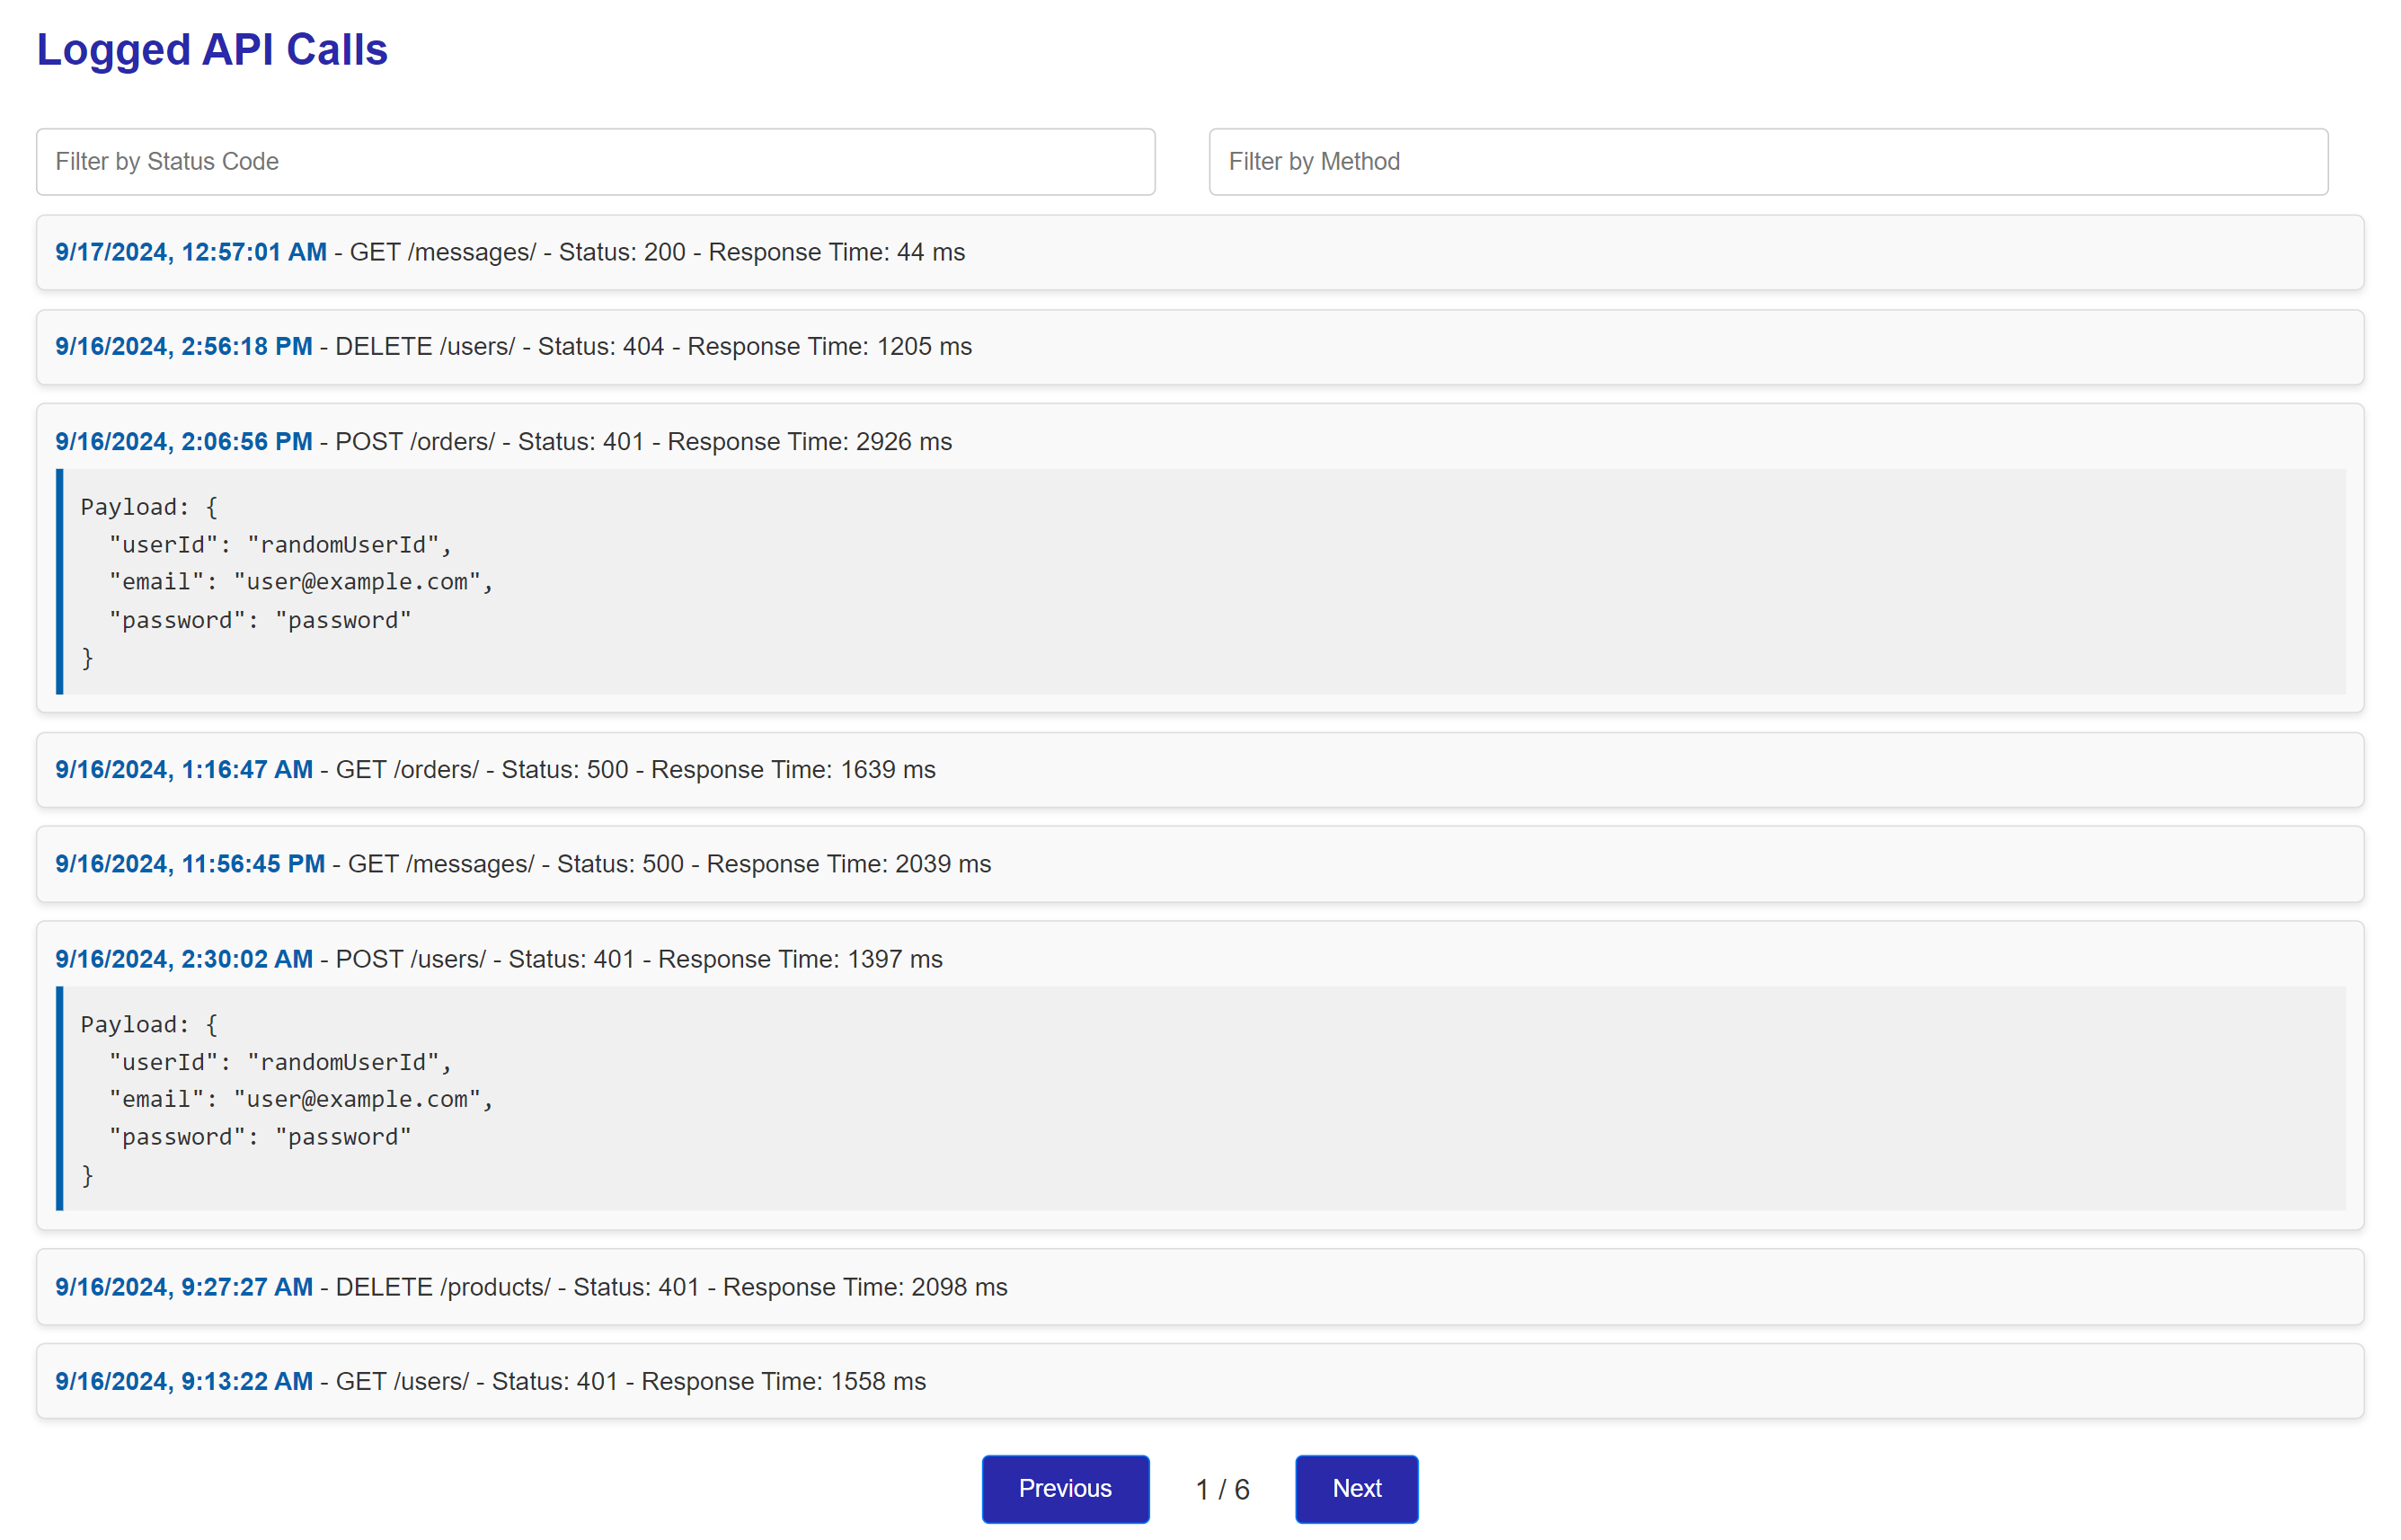
Paginated Logs: A paginated table displaying individual API call logs with filters for HTTP method and status code.
Endpoint-Specific Reports
MetricBoard also generates detailed reports for individual API endpoints within each microservice. These reports include the same metrics as the overall report but are focused on a particular endpoint.
For instance, a report for /api/users would be saved as:
metrics/microservice1/api_users_report.htmlBenefits
- Improved Performance Monitoring:
- Gain insights into microservice performance with response times and API call distributions.
- Identify slow endpoints and optimize them.
- Easily Accessible Visual Reports:
- HTML reports with embedded charts make it easy to analyze service health without diving into raw logs.
- Microservice-Specific Metrics:
- Each microservice has its own dedicated logs and reports, allowing you to focus on performance metrics per service.
License
MetricBoard is licensed under the Apache-2.0 License.
Contributions
We welcome contributions from the open-source community. Please submit issues or pull requests on the official GitHub repository.
Connect Here.