
mapbox-gl-choropleth-grid-layer
v3.0.3
Published
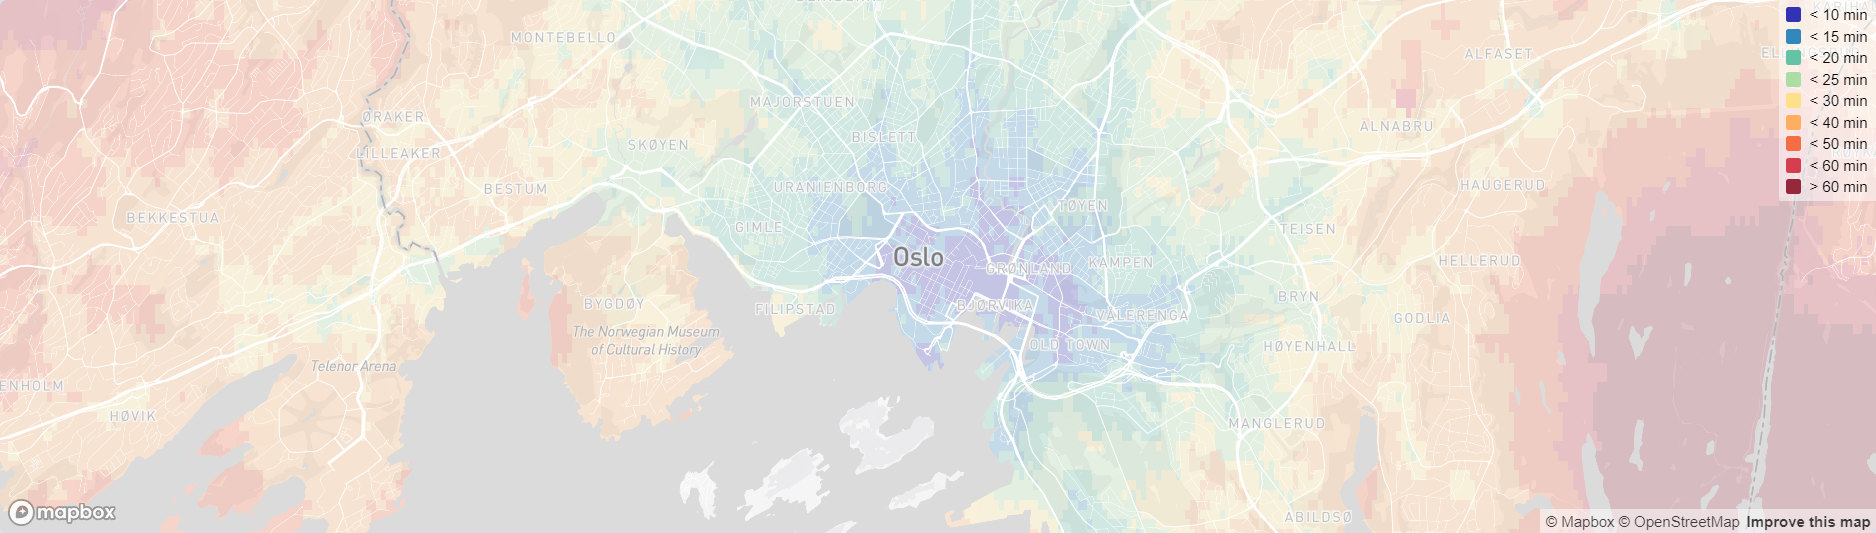
Custom layer for mapbox-gl that efficiently displays large sets of world space data as a grid of colors. [View demo](https://ptnoavailability.z1.web.core.windows.net)
Downloads
5
Maintainers
 hhermanb
Readme
Demo
Custom layer for mapbox-gl that efficiently displays large sets of world space data as a grid of colors. View demo
Features
- Display data in world coordinates (latitide and longitude)
- Processor and memory efficient rendering with WebGL
Installation
npm install mapbox-gl-choropleth-grid-layer
Usage (TypeScript)
IMPORTANT
This layer only supports the Mercator projection
// Create an instance of the layer
const gridLayer = createLayer({
    // Your data in a 2D array
    dataGrid: [
        [1, 1, 2]
        [1, 2, 3]
        [2, 3, 3]
    ],
    // Function that returns a color for each cell in the grid
    getColor: x => {
        switch(x) {
            case 1: return [255, 0, 0, 255];
            case 2: return [0, 255, 0, 255];
            case 3: return [0, 0, 255, 255];
            default: return [0, 0, 0, 0];
        }
    },
    // The world space size of each cell in the grid
    stepSize: {
        lat: 0.1,
        lng: 0.1
    },
    // The origin of the grid in world space (south west)
    offset: {
        lat: 59.78,
        lng: 10.6
    },
    // The opacity of the layer
    opacity: 0.25
});

// Add the layer to the map
map.addLayer(gridLayer);