
manowar
v1.0.1
Published
visually differentiate request logs via indentation, coloring, and namespacing via cls-hooked
Downloads
29
Maintainers
 jnvm
jnvmReadme
Man O' War Logger
Have difficulty matching concurrent request event logs?
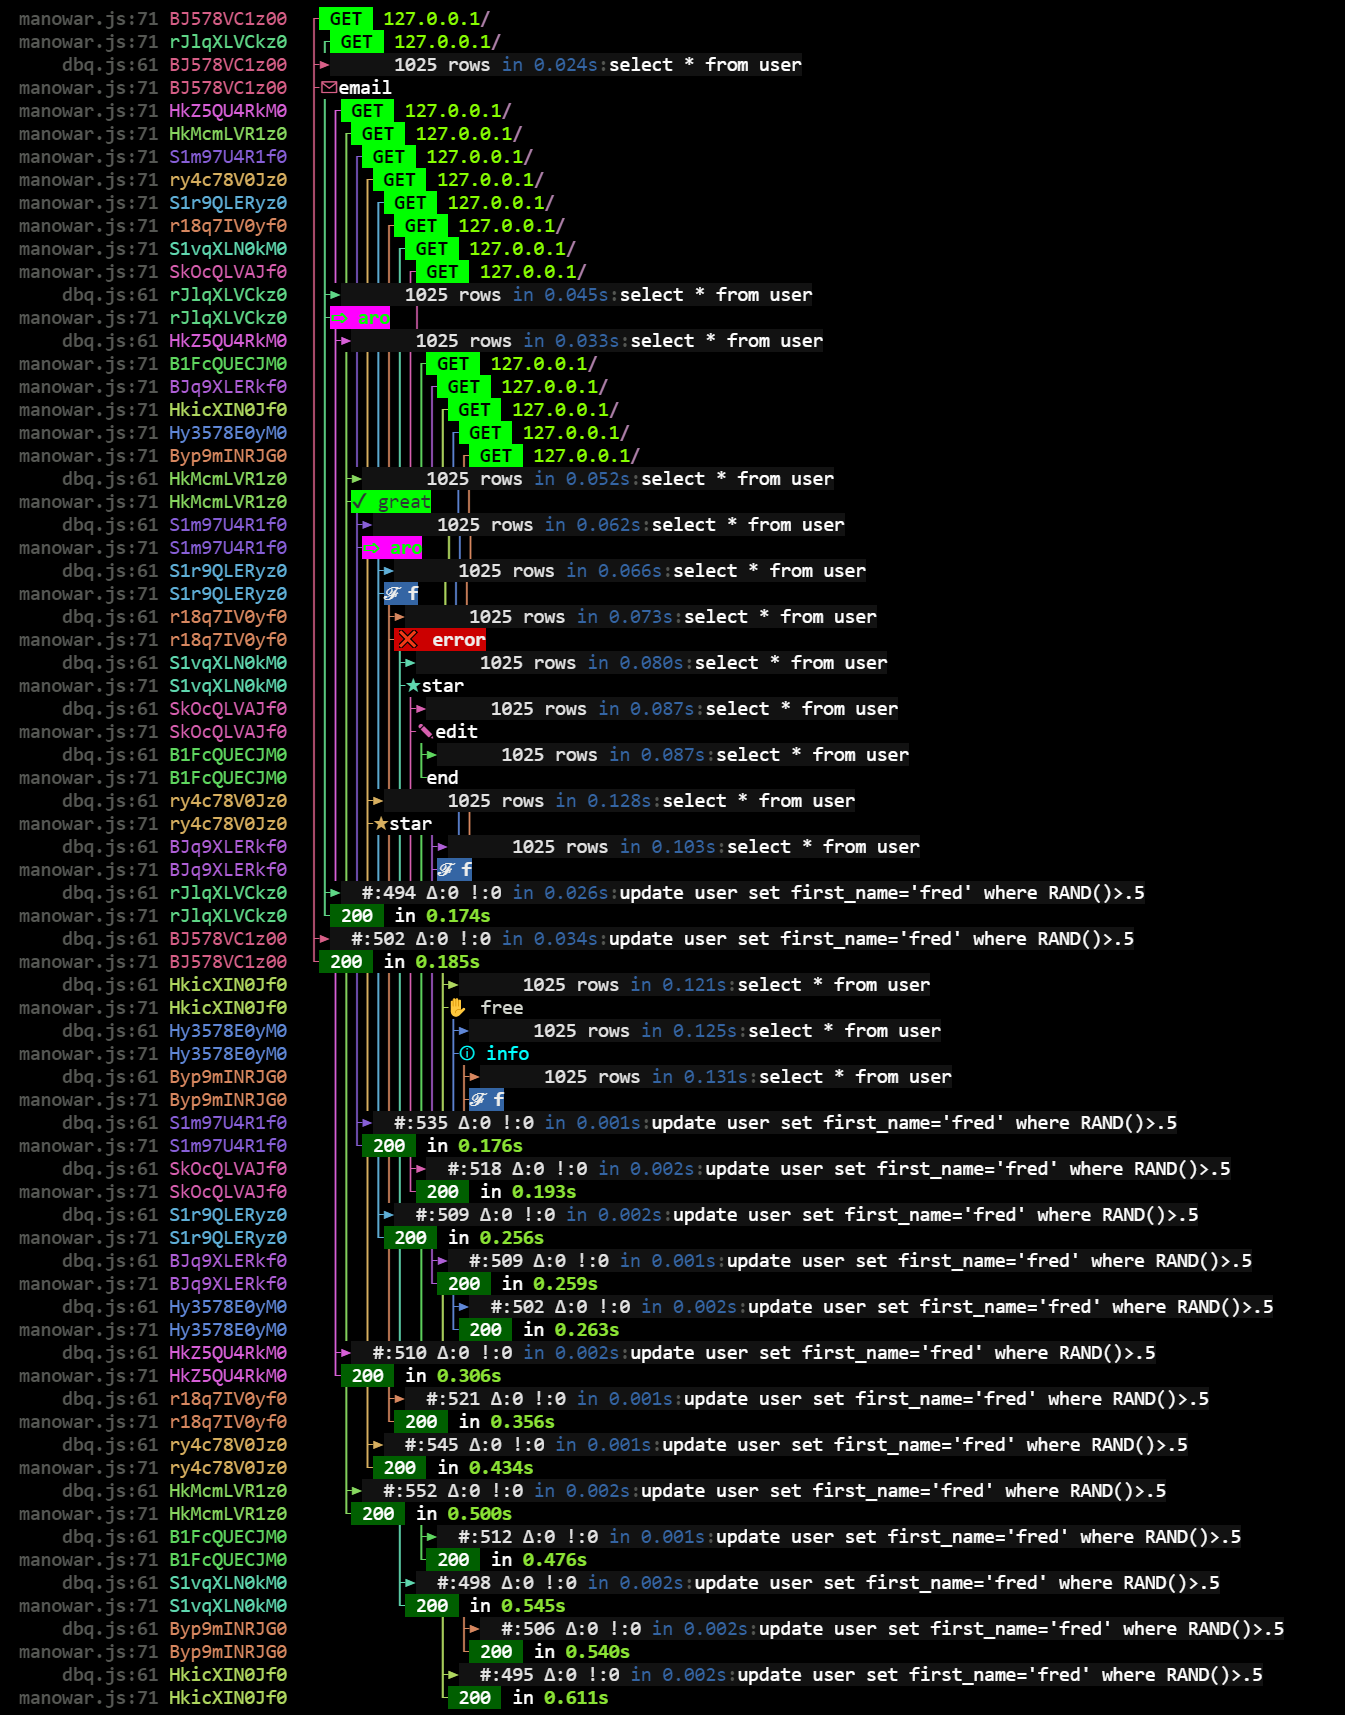
This module provides a live logger that indents each request's logs a uniform amount, connecting them all along a line. (or tendril on a Portugese Man O' War!)
This helps visualize a few things:
- in what order async events occur ...in sync (so this isn't applicable to true parallelism in, say, web workers)
- which requests generated which logs in concurrent-traffic scenarios, supplemented by a correlation_id for records
- how long requests take
- file line references generating logs
- also it is colorful
This requires a few things to work:
- that you use the provided
cc()logger, which is a terse, icon-able, chalk-colorable, extendable way to log things- (this also provides
cc.sql, a log format ideal to plug into dbq, should you use that)
- (this also provides
- that you include the
requestLoggerexpress middleware atop your router (or above all the routes you want logs for), which itself does a few things:- initiate the request's indentation, which is maintained until it replies or dies
- log out some req info
- kill requests that take longer than
forceRequestKillAftermilliseconds (defaults to 10 seconds) - times requests for reference
Usage & Options
var {cc,requestLogger}=require("manowar")({
        //option:default
        ellipsize:true //cut off log lines once they exceed window width
        ,forceRequestKillAfter:10000//kill requests that take longer than this many milliseconds. Falsy = never.
        ,logEachReq:(req,res)=>false //a fxn for you to customize the incoming request log. Return false to defer to plugin default
        ,overrideIconsWith:"" //some displays don't correctly space icons & break the line display. Override them here
		,logBody:true //whether to log request bodies
		,fileNameSize:20 //max width to allow for file names on the left
		,fileLineFilter:false //if you need a custom stacktrace filter to get the file name
		,maxIdLength:11 //length of id col
		,idMaker:require('shortid').generate //if you want to supply IDs your own way
		,widthFudgeFactor:0//maybe process.stdout.columns lies on your box
		,logSync:false//fs.writeSync vs console.log
        ,cc:{//any custom logging shortcuts you'd like.
            //coming soon
        }
    })
    ,app=express()
    ,router=express.Router()

router.use(requestLogger)
    //[then add your routes, use logging wherever...like:]
    .get("/*",(req,res)=>{
        cc(`logging a special message!`)
        res.send("howdy")
    })


app.use(router)
Logging defaults
cc('text') logging works, but extra colors & icons are available at cc.* (if you leave icons on):
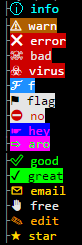
Additionally:
cc.chalkexists for you to stylize additional logs locally withchalkcc.namespacewill give you access to the currentcls-hookednamespacemanowarset up to manage indentation, should you like to use it or attach more info in a local scope.