
khulnasoft-apptracing-panel
v6.3.9
Published
The KhulnaSoft Tracing Panel visualizes the full-stack call path of distributed links through flame graphs, which can help developers, system operators, and cloud operators quickly identify performance bottlenecks and errors in calls.
Downloads
5

Readme
KhulnaSoft Tracing Panel
The KhulnaSoft Tracing Panel visualizes the full-stack call path of distributed links through flame graphs, which can help developers, system operators, and cloud operators quickly identify performance bottlenecks and errors in calls.
can only work with KhulnaSoft datasource and use the Distributed Tracing - Flame app type.**
Feature
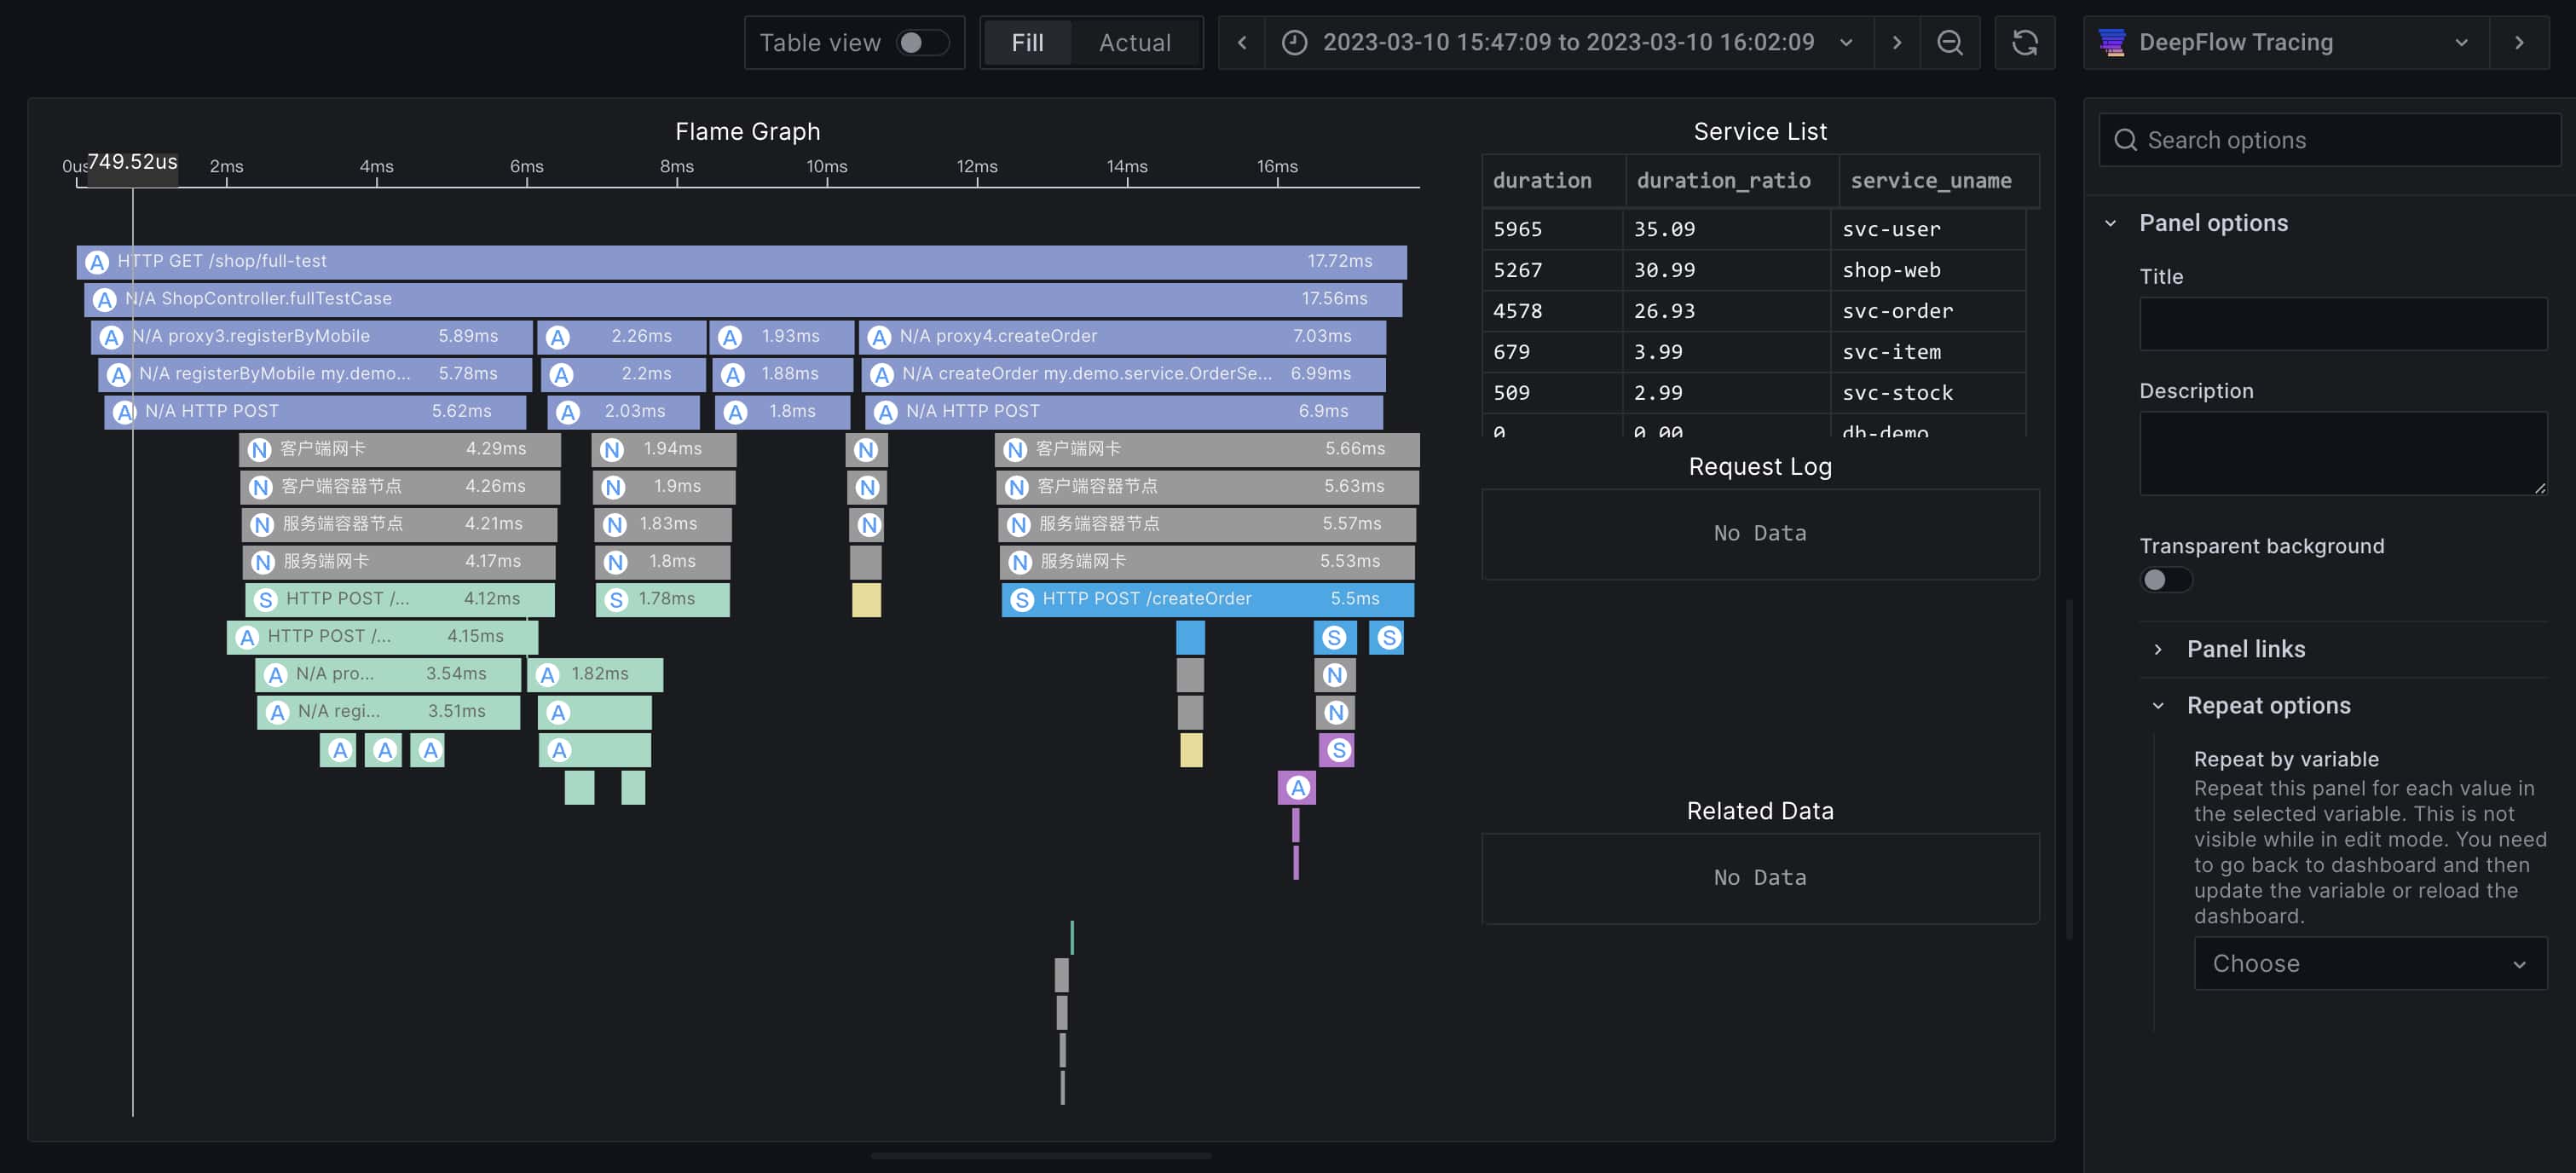
The KhulnaSoft Tracing Panel consists of four parts: Flame Graph, Service List, Request Log, and Related Data. Flame Graph visualizes each service call that occurs during the execution path of a request as a bar, and displays different information for each bar based on the actual call. Clicking on a bar will display the corresponding service, log, and related data in the data panel on the right, helping you quickly analyze program performance. Next, we will provide a detailed explanation of the usage and functions of each part.
Flame Graph
Flame Graph's x-axis is based on time, and its y-axis is based on the depth of the call stack, and displays the order of Span calls from top to bottom. The flame graph consists of multiple bar-shaped bars, each representing a Span, and supports various operations on the bars.
- The composition of a bar:
Icon+Call Information+Execution Time- Icon: Differentiates Span types
- A: Application Span, collected through the Opentelemetry protocol, covering business code and framework code
- S: System Span, collected through eBPF zero-intrusion, covering system calls, application functions (such as HTTPS), API Gateway, and service mesh sidecar
- N: Network Span, collected through BPF from network traffic, covering container network components such as iptables, ipvs, OvS, and LinuxBridge
- Call Information: For Application Span and System Span, it displays the
application protocol,request type,request resource; for Network Span, it displaysthe path statistics position - Length: Expresses the execution time of a Span
- Icon: Differentiates Span types
- Operations: Supports hover and click
- Operations: Supports hover and click Hovering over a bar displays the relevant information of the corresponding Span in the form of a tooltip
- For Application Span and Network Span:
application protocol,request type,request resource,service name,duration - For System Span:
application protocol、request type、request resource、service name、system language、duration - Execution Time: Displays the entire execution time of the Span and the percentage of its own execution time
- For Application Span and Network Span:
- Click: Clicking on a bar highlights itself and its parent Span, and the data panel on the left displays the detailed information of the Span
- Operations: Supports hover and click Hovering over a bar displays the relevant information of the corresponding Span in the form of a tooltip
Service List
The Service List displays the names of the services called during the request process, the time generated by the service call, and the proportion of time it takes in the entire request time.
- Clicking on a service in the list will highlight the Span that calls this service in the Flame Graph
Request Log
The Request Log displays the log generated by a single call.
- Clicking on a Span in the Flame Graph displays the log generated by that Span
Related Data
The Related Data records relevant information that can be traced by the Span, such as traffic collection location, application protocol, request type, request resource, tracid, spanid, parent spanid, system call tracing request id, TCP sequence number, and other data.
- Clicking on a Span in the Flame Graph will display the relevant Span information traced by that Span.