
js-perf-visualizer
v0.10.5
Published
Easy to understand JavaScrip Performance Visualization tool to understand when and why your UI becomes unresponsive or your animation is lagging.
Downloads
5

Readme
JS Perf Visualizer
Easy to understand JavaScrip Performance Visualization tool to understand when and why your UI becomes unresponsive or your animation is lagging.
Install
npm install --save-dev js-perf-visualizerUse
Add it to your index.html
<script src="node_modules/js-perf-visualizer/build-es5/JsPerfVisualizer.js"></script>
<script>
  window.jsPerfVisualizer = new JsPerfVisualizer.default();
</script>
or add it to your index.js
import JsPerfVisualizer from 'js-perf-visualizer';
...
const jsPerfVisualizer = new JsPerfVisualizer();
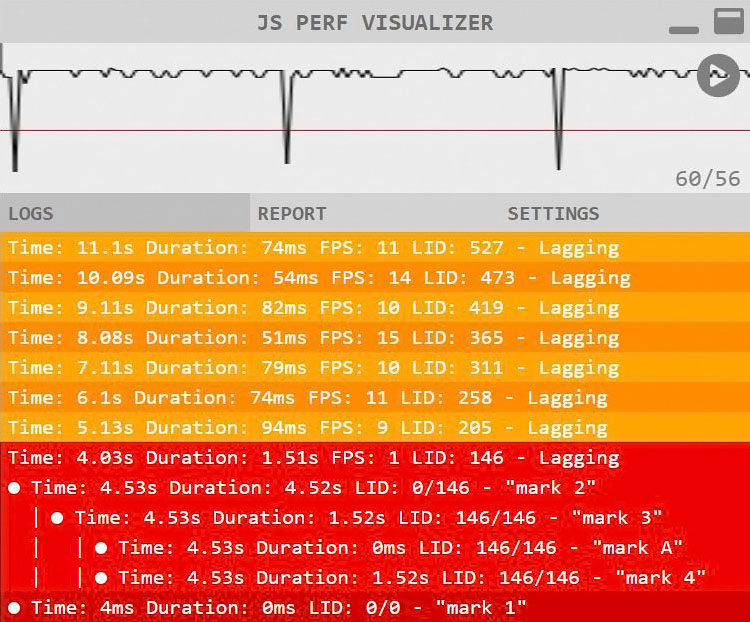
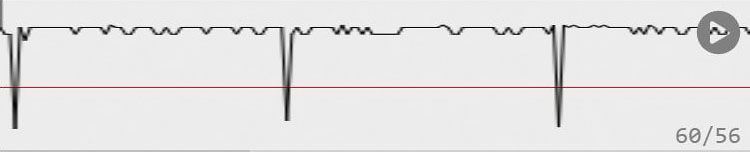
...Graph
Graph makes it obvious when exactly and how much your UI becomes unresponsive or your animation starts lagging.
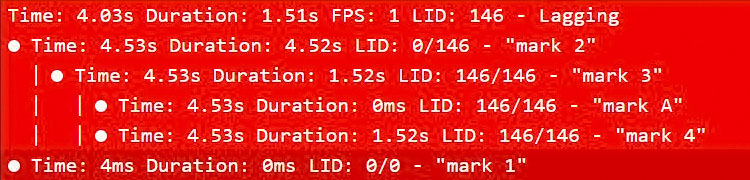
Start/Stop Marks
Use jsPerfVisualizer.mark.start('some mark text'); and jsPerfVisualizer.mark.stop('some mark text'); to fin the source of your lagging by starting to break it up and measure the parts. Indentation suggest that a mark was triggered why an other was still running.
Note: If you would like to see your mark in the report, pass in true as second argument, e.g.: jsPerfVisualizer.mark.start('mark text in report', ture);
Options
You can pass in options at instantiation. E.g.:
const jsPerfVisualizer = new JsPerfVisualizer({
  fpsTarget:            60,
  fpsWarningLevel:      30,
  isAutoStart:          true,
  isMinimizedByDefault: false,
});
Available Option
| OPTION | DESCRIPTION |
|---|---|
| fpsTarget | Even if your app has a higher frame rate, JS P. V. won't measure it, otherwise it starts impacting performance. |
| fpsWarningLevel | If JS performance drops below this number you will get a warning in Logs tab and you can start dig in using jsPerfVisualizer.mark.start('...'); |
| isAutoStart | Block JS P. V. from starting automatically by setting this option to false. When any page loads there a bunch of activity that is outside of your control - e.g. Chrome Extension loading, Engine parsing loaded scripts - that impacts performance but you might not want to include it in your perf report. Use JsPerfVisualizer.start() when you app start to kick it off manually.|
| isMinimizedByDefault | Use JS P. V. only when you need it by pressing Ctrl+i and let it run in the background when you don't.|
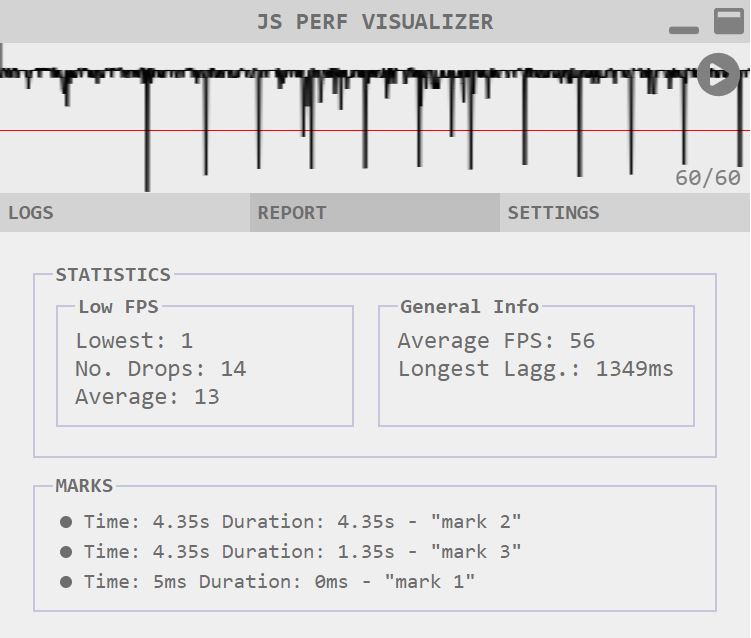
Report
Get a report on the most important performance characteristics, low FPS, and the marks you use to measure specific parts of your application, e.g: img hashing.
Note: If you would like to see your mark in the report, pass in true as second argument, e.g.: jsPerfVisualizer.mark.start('mark text in report', ture);
CLI Integration
Run a performance test as part of your build/deploy and generate a report as JSON for further analysis by calling jsPerfVisualizer.genReport()
{ "averageFps":     57,
  "laggingLongest": 1509.33,
  "lowFps": {
    "average":  10,
    "lowest":   1,
    "noDrop":   8
  },
  "listMark":[
    {
      "type": "mark",
      "ctr":  1,
      "idEvtLoopStart": 0,
      "idEvtLoopStop":  146,
      "timestampStart": 1566353303579,
      "timeFromInit":   4528,
      "timestampStop":  1566353308103,
      "duration":       4524,
      "text":           "mark 2",
      "indentLevel":    0,
      "isPartOfReport": true
    }
  ]
}
or call jsPerfVisualizer.genReportAsString() for a human readable format.
* ************************* *
* JS PERF VISUALIZER REPORT *
* ************************* *

GENERAL INFO
> Average FPS : 57
> Longest Lagg: 1509.33

FPS IN LOW RANGE
> Average FPS: 10
> Lowest FPS : 1
> No Drops   : 8

MARKS
> Duration: 4524ms "mark 2"
> Duration: 1523ms "mark 3"
> Duration:    0ms "mark 1"
Tips and Tricks
Use #showJsPerfVisualizer in the URL to bring up the UI if you cant press Ctrl + I on your keyboard from some reason.
E.g.: http://mySite.com/#showJsPerfVisualizer