
interpolated-charts
v1.3.1
Published
Configurable d3 v4 charts with interpolation and missing data range
Downloads
38

Readme
Interpolated Charts
Configurable d3 v4 charts with interpolation and missing data range. Inspired by Britecharts
Angular component here
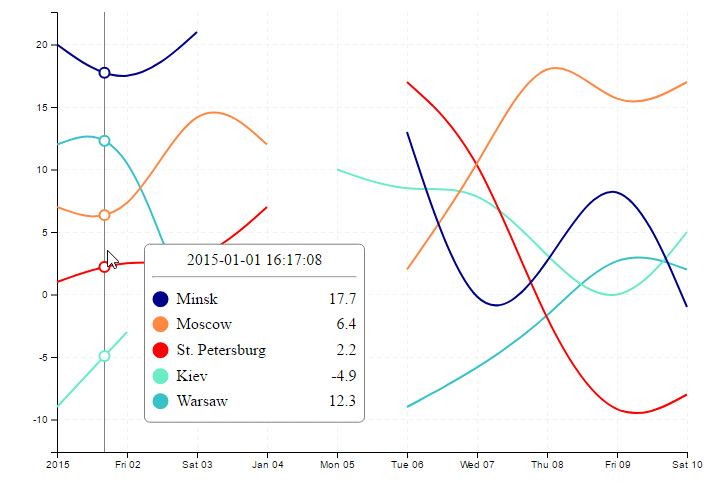
![]()
Description
- Configurable line chart with tooltip and markers
- Gasps between data points (missing data range)
- Compute and display interpolated values between data points
Iterpolation values are calculated on svg path element using the binary search method. It means that after changing chart curve type (d3.curveBasis, d3.curveCatmullRom, ...) computed values can change. Do not rely on this data if you need high accuracy.
Installation
- Install with npm
npm install interpolated-charts --save- Import JS dependencies
import * as d3 from 'd3';
import { line, stackBar, chartEvents, verticalDivider, markers, tooltip } from 'interpolated-charts';- Import CSS
@import 'interpolated-charts/src/index.css'Usage
Package include line chart and three plugins: vertical divider, markers highlight, tooltip information. Line chart dispatch mouse events (chartMouseEnter, chartMouseLeave, chartMouseMove, chartMouseClick), defined in chartEvents. Default configuration for chart with plugins:
const verticalDividerPlugin = verticalDivider();
const markersPlugin = markers();
const tooltipPlugin = tooltip();

const lineChart = line()
  // subscribe plugins to chart events
  .on(chartEvents.chartMouseEnter, () => {
    verticalDividerPlugin.show();
  })
  .on(chartEvents.chartMouseLeave, () => {
    verticalDividerPlugin.remove();
    markersPlugin.remove();
    tooltipPlugin.remove();
  })
  .on(chartEvents.chartMouseMove, (options) => {
    verticalDividerPlugin.update(options);
    markersPlugin.show(options);
    tooltipPlugin.show(options);
  });

// create chart with data
const chartContainer = d3.select('.default-chart');
chartContainer.datum(lineChartData).call(lineChart);

// bind plugins to chart
const metadataContainer = d3.select('.default-chart .metadata-container');
metadataContainer.datum([]).call(verticalDividerPlugin);
metadataContainer.datum([]).call(markersPlugin);
metadataContainer.datum([]).call(tooltipPlugin);
Chart data example:
const lineChartData = [
  // each object represent chart line dataset
  {
    'name': 'Minsk',
    // optional color
    'color': 'darkblue',
    'data': [
      { 'date': new Date('2015-01-01T00:00:00'), 'value': 20 },
      { 'date': new Date('2015-01-02T00:00:00'), 'value': 16 }
    ]
  }
]
Default chart is first example on demo page.
Source code for examples - /demo.
Package include internal @types for Typescript.
Documentation
Line Chart
Usage
// create chart with custom config
const lineChart = line({ width: 900 });
// set property on existing chart
lineChart.curve(d3.curveCatmullRom);
// get d3 selection for chart container
const chartContainer = d3.select('.default-chart');
const lineChartData = [/* PathDataSet[] */];
// bind selection with data and call chart creation
chartContainer.datum(lineChartData).call(lineChart);
Chart data format
interface PathDataSet {
  name: string;
  color?: string;
  data: { date: Date, value: number }[];
}
Events
chartEvents.chartMouseEnter - mouse entered chart boundary. Arguments - mouse coordinates x, y relative to chart;
chartEvents.chartMouseLeave - mouse leaved chart boundary. Arguments - mouse coordinates x, y relative to chart;
chartEvents.chartMouseMove - mouse moved inside chart boundary. Event treshhold (mouseMoveTimeTreshold, ms) - min time between events. Arguments - { x: number, y: number, selectedDate: Date, data: PointData[] }. data - array of closest chart points data based on mouse current position:
interface PointData {
  // concrete values from PathDataSet and their coordinates on graph
  date: Date;
  value: number;
  x: number;
  y: number;
  // interpolated values, closest to mouse position
  interpolatedX: number;
  interpolatedY: number;
  interpolatedDate: Date;
  interpolatedValue: number;

  name: string;
  color: string;
}
chartEvents.chartMouseClick - mouse click inside chart boundary. Arguments - { x: number, y: number, selectedDate: Date, data: PointData[] }.
CSS
Chart grid lines css classes:
.line-chart .horizontal-grid-line, .line-chart .vertical-grid-line
Options
Name | Description | Type | Default --- | --- | --- | --- width | Chart total width | Number | 700 height | Chart total height | Number | 500 margin | Chart graph margin to outer bounds | { top: number, right: number, bottom: number, left: number } | { top: 20, right: 30, bottom: 40, left: 40 } maxTimeRangeDifferenceToDraw | Max time in milliseconds to treat dataset points without breaking | Number | 1000 * 60 * 60 * 24 * 1.5 (1.5 days) xAxisTimeFormat | Date tick format for chart X Axis | d3.tickFormat | undefined yAxisValueFormat | Value tick format for chart Y Axis | d3.tickFormat | undefined curve | Curve type for line interpolation. Important: value interpolation compute on chart resulted line and depend on this config value | d3.curve | d3.curveBasis chartHeight | Chart graph actual heigth getter. Total height - (margin.top + margin.bottom) | Number | chartWidth | Chart graph actual width getter. Total width - (margin.left + margin.right | Number | interpolationMaxIterationCount | Interpolation cycle count. Computing will stop after N cycle or when Δx < accuracy Important: high value can slow preformance | Number | 50 interpolationAccuracy | Interpolation Δx accuracy for searching y value on svg path. Computing will stop after N cycle or when Δx < accuracy | Number | 0.005 mouseMoveTimeTreshold | Minimum time in milliseconds between chartMouseMove events | Number | 20 xAxisDateFrom | Chart X Axis start date | Date | undefined xAxisDateTo | Chart X Axis end date | Date | undefined
Bar chart
Usage
// create bar chart
const barChart = bar();

const barChartContainer = d3.select('.bar-bar');
const barChartData = [/* PathDataSet[] */];
// bind selection with data and call chart creation
barChartContainer.datum(barChartData).call(barChart);
Chart data format
Array of
interface StackBarData {
  name: string;
  backgroundColor?: string;
  data: {
    date: Date,
    color?: string,
    value: any
  }[];
}
Events
chartEvents.chartMouseEnter - mouse entered chart boundary. Arguments - mouse coordinates x, y relative to chart;
chartEvents.chartMouseLeave - mouse leaved chart boundary. Arguments - mouse coordinates x, y relative to chart;
chartEvents.chartMouseMove - mouse moved inside chart boundary. Event treshhold (mouseMoveTimeTreshold, ms) - min time between events. Arguments - { x: number, y: number, selectedDate: Date, data: MouseEventBarChartData[] }. data - array of closest chart points data based on mouse current position:
chartEvents.chartMouseClick - mouse click inside chart boundary. Arguments - { x: number, y: number, selectedDate: Date, data: MouseEventBarChartData[] }.
Options
Name | Description | Type | Default --- | --- | --- | --- width | Chart total width | Number | 700 height | Chart total height | Number | 120 margin | Chart graph margin to outer bounds | { top: number, right: number, setStackWidth | Function to compute stack width | Function | (chartWidth, numberOfBars) => chartWidth / numberOfBars - 20 maxTimeRangeDifferenceToDraw | Max time in milliseconds to treat dataset points without breaking | Number | 1000 * 60 * 60 * 24 * 1.5 (1.5 days) stackTimeDiapason | Time diapason for one stack | Number | 1000 * 60 * 60 * 24 xAxisTimeFormat | Date tick format for chart X Axis | d3.tickFormat | undefined yAxisValueFormat | Value tick format for chart Y Axis | d3.tickFormat | undefined xAxisDateFrom | Chart X Axis start date | Date | undefined xAxisDateTo | Chart X Axis end date | Date | undefined yAxisValueFrom | Chart Y Axis start value | Number | undefined yAxisValueTo | Chart Y Axis end value | Number | undefined
Stack bar
Usage
// create stack bar
const stackBarChart = stackBar();

const stackBarContainer = d3.select('.stack-bar');
const stackBarData = [/* StackBarData[] */];
// bind selection with data and call chart creation
stackBarContainer.datum(stackBarData).call(stackBarChart);
Chart data format
Array of
interface PathDataSet {
  name: string;
  color?: string;
  data: { date: Date, value: number }[];
}
Events
chartEvents.chartMouseEnter - mouse entered chart boundary. Arguments - mouse coordinates x, y relative to chart;
chartEvents.chartMouseLeave - mouse leaved chart boundary. Arguments - mouse coordinates x, y relative to chart;
chartEvents.chartMouseMove - mouse moved inside chart boundary. Event treshhold (mouseMoveTimeTreshold, ms) - min time between events. Arguments - { x: number, y: number, selectedDate: Date, diapasonStart: Date, diapasonEnd: Date, data: MouseEventBarChartData[] }. data - array of closest chart points data based on mouse current position:
chartEvents.chartMouseClick - mouse click inside chart boundary. Arguments - { x: number, y: number, selectedDate: Date, data: StackBarEventData[] }.
Options
Name | Description | Type | Default --- | --- | --- | --- width | Chart total width | Number | 700 height | Chart total height | Number | 120 margin | Chart graph margin to outer bounds | { top: number, right: number, marginBetweenStacks | Vertical margin between multiple stack bars | Number | 0 backgroundColor | Chart background color | String | '#CCCCCC' maxTimeRangeDifferenceToDraw | Max time in milliseconds to treat dataset points without breaking | Number | 1000 * 60 * 60 * 24 * 1.5 (1.5 days) mouseMoveTimeTreshold | Minimum time in milliseconds between chartMouseMove events | Number | 20 xAxisTimeFormat | Date tick format for chart X Axis | d3.tickFormat | undefined xAxisDateFrom | Chart X Axis start date | Date | undefined xAxisDateTo | Chart X Axis end date | Date | undefined
Plugins
Vertical divider
Display vertical line on chart.
Usage
const lineChart = line({ height: 1000 });
// create plugin
const verticalDividerPlugin = verticalDivider();
// set divider height if chart height not default
verticalDividerPlugin
  .height(lineChart.chartHeight());
// subscribe plugin to chart events
lineChart
  .on(chartEvents.chartMouseEnter, (x, y) => verticalDividerPlugin.show())
  .on(chartEvents.chartMouseLeave, (x, y) => verticalDividerPlugin.remove())
  .on(chartEvents.chartMouseMove, (options) => verticalDividerPlugin.update(options));
// create line chart
d3.select('.interpolated-chart').datum([/* chart data */]).call(lineChart);
// select metadata container inside chart
const metadataContainer = d3.select('.interpolated-chart .metadata-container');
// call plugin creation
metadataContainer.datum([]).call(verticalDividerPlugin);
CSS
Divider line css class:
.line-chart .divider
Options
Name | Description | Type | Default --- | --- | --- | --- height | Divider line height | Number | 440
Methods
Name | Description | Arguments --- | --- | --- remove | Hide divider | None show | Show divider | None update | Set divider position | { x: number }
Markers
Usage
const lineChart = line({ height: 1000 });
// create plugin with options
const markersPlugin = markers()
  .fill(data => {
    return data.interpolatedValue > 10 ? data.color : 'white'
  });
// set options
markersPlugin
  .radius(data => {
    return data.interpolatedValue > 10 ? 10 : 5
  })
// subscribe plugin to chart events
lineChart
  .on(chartEvents.chartMouseEnter, (x, y) => markersPlugin.show())
  .on(chartEvents.chartMouseLeave, (x, y) => markersPlugin.remove())
  .on(chartEvents.chartMouseMove, (options) => markersPlugin.update(options));
// create line chart
d3.select('.interpolated-chart').datum([/* chart data */]).call(lineChart);
// select metadata container inside chart
const metadataContainer = d3.select('.interpolated-chart .metadata-container');
// call plugin creation
metadataContainer.datum([]).call(markersPlugin);
Options
Name | Description | Type | Default --- | --- | --- | --- cx | Marker X position calculator | Function | data => data.interpolatedX || data.x cy | Marker Y position calculator | Function | data => data.interpolatedY || data.y radius | Marker radius calculator | Function | data => 5 fill | Marker fill color calculator | Function | data => 'white' stroke | Marker stroke color calculator | Function | data => data.color || 'red' strokeWidth | Marker stroke width calculator | Function | data => 2 sort | Marker sorting function. First value will be displayed on top of others | Function | (a, b) => 0
Methods
Name | Description | Arguments --- | --- | --- remove | Hide markers | None show | Show markers | { data: ChartLinePointData[] }
Tooltip
Tooltip - html foreignObject in svg chart.
Usage
const lineChart = line({ height: 1000 });
// create plugin with options
const verticalDividerPlugin = verticalDivider({ chartHeight: lineChart.chartheight() });
// set options
tooltipPlugin
  .chartWidth(lineChart.chartWidth())
  .valueFormatter(({ interpolatedValue }) => `${interpolatedValue.toFixed(1)}°C`);
// subscribe plugin to chart events
lineChart
  .on(chartEvents.chartMouseEnter, (x, y) => tooltipPlugin.show())
  .on(chartEvents.chartMouseLeave, (x, y) => tooltipPlugin.remove())
  .on(chartEvents.chartMouseMove, (options) => tooltipPlugin.update(options));
// create line chart
d3.select('.interpolated-chart').datum([/* chart data */]).call(lineChart);
// select metadata container inside chart
const metadataContainer = d3.select('.interpolated-chart .metadata-container');
// call plugin creation
metadataContainer.datum([]).call(tooltipPlugin);
CSS
.line-chart .tooltip
.line-chart .tooltip rect
.line-chart .tooltip .tooltip-container
.line-chart .tooltip .tooltip-header
.line-chart .tooltip .tooltip-header p
.line-chart .tooltip .circle
.line-chart .tooltip .topic
.line-chart .tooltip .topic-name
.line-chart .tooltip .topic-value
Options
Name | Description | Type | Default --- | --- | --- | --- chartHeight | Chart height (used to compute tooltip boundaries) | Number | 440 chartWidth | Chart width (used to compute tooltip boundaries) | Numner | 700 tooltipWidth | Tooltip fixed width | Number | 220 horizontalMouseMargin | Tooltip horizontal distance from mouse pointer | Number | 40 verticalBorderMargin | Tooltip min distance from chart top and bottom borders | Number | 10 headerFormatter | Tooltip header formatter function. Arguments - selected interpolated date and chart dataset values | Function | (selectedDate, data) => d3.timeFormat('%Y-%d-%m %H:%M:%S')(selectedDate) topicFormatter | Tooltip path data description formatter | Function | (data) => data.name valueFormatter | Tooltip path data value formatter | Function | (data) => d3.format('.1f')(data.interpolatedValue) sort | Tooltip path data sorting function. First value will be displayed on top of tooltip | Function | (a, b) => 0
Methods
Name | Description | Arguments --- | --- | --- remove | Hide tooltip | None show | Show tooltip | { x: number, y: number, selectedDate: Date, data: ChartLinePointData[] }
TODO
- [x] Tests
- [ ] JSDoc
- [x] Documentation
- [ ] Display curve single points in missing data range and add them to tooltip