
gramex-sankey
v1.2.1
Published
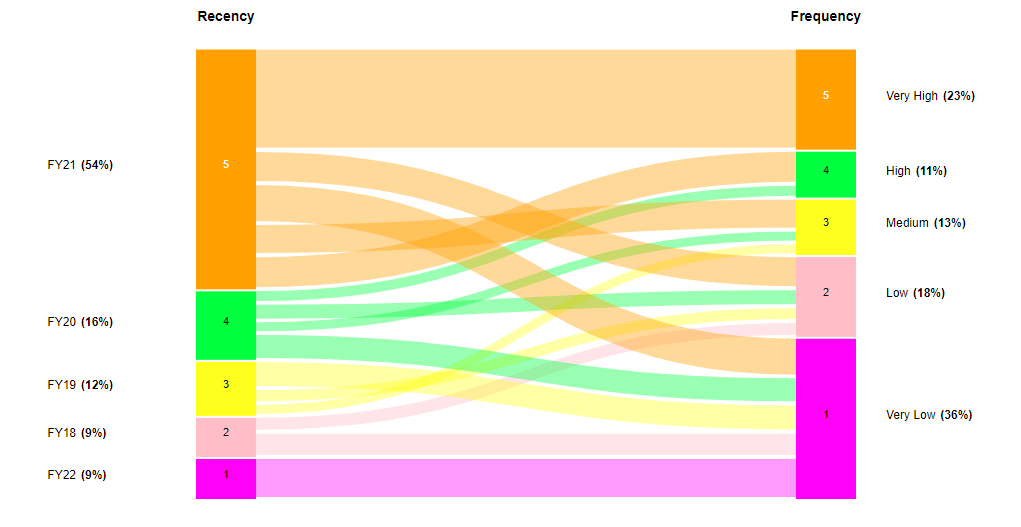
A Sankey chart built with vega that uses 5 data points from frequency to recency.
Downloads
48

Readme
Reusable-Sankey chart
A Sankey chart built with vega that uses 5 data points from frequency to recency.
Output:
Installation
Download the library via npm:
npm install gramex-sankeyDependencies
npm install bootstrap
npm install g1
npm install jquery
npm install lodash
npm install vega
To set it up, include this in your HTML:
<script src="node_modules/jquery/dist/jquery.min.js"></script>
<script src="node_modules/lodash/lodash.min.js"></script>
<script src="node_modules/g1/dist/g1.min.js"></script>
<script src="node_modules/d3/dist/d3.min.js"></script>
<script src="node_modules/vega/build/vega.min.js"></script>
<script src="node_modules/gramex-sankey/index.js"></script>- Call render_sankey_vega_chart function with parameters => data, selector and configuration
Parameters
| Name | Type | Description | | -------- | ---------------- | ------------------------------------------------------------------------------------------------------------------------------------------------------------------------------------------------------------------------- | | Data | Array of Objects | Data takes array of objects, each object should have source_categorysource_value,target_category,abs_value,value. abs_value is the absolute value, wherein value is the % of share of source/target in all source/target. | | Selector | String | Eg: "#sankey_chart" |
Configuration options
| Name | Type | Description | | ----------------------------------------------------------------- | ------------------------------------------------------------------------ | ----------- | | colors | Object | This will accept list of colors to be used by source nodes/target nodes. | | nodecolors | List of Objects | Text color in the nodes can be altered between black(dark) and white(light). | | Headings | List of 2 values |Names to be denoted on top of the source and target bars. |
Usage/Examples
HTML
<div class="card-body h-500" id="sankey_chart"></div>JS
var chart_data = [
  {
    source_category: 1,
    source_value: "FY22",
    target_category: 1,
    abs_value: 3135,
    value: 9.3,
  },
  {
    source_category: 2,
    source_value: "FY18",
    target_category: 1,
    abs_value: 1874,
    value: 5.6,
  },
  {
    source_category: 2,
    source_value: "FY18",
    target_category: 2,
    abs_value: 1190,
    value: 3.5,
  },
  {
    source_category: 3,
    source_value: "FY19",
    target_category: 3,
    abs_value: 958,
    value: 2.8,
  },
  {
    source_category: 3,
    source_value: "FY19",
    target_category: 2,
    abs_value: 1128,
    value: 3.3,
  },
  {
    source_category: 3,
    source_value: "FY19",
    target_category: 1,
    abs_value: 2139,
    value: 6.3,
  },
  {
    source_category: 4,
    source_value: "FY20",
    target_category: 1,
    abs_value: 1990,
    value: 5.9,
  },
  {
    source_category: 4,
    source_value: "FY20",
    target_category: 3,
    abs_value: 937,
    value: 2.8,
  },
  {
    source_category: 4,
    source_value: "FY20",
    target_category: 2,
    abs_value: 1321,
    value: 3.9,
  },
  {
    source_category: 4,
    source_value: "FY20",
    target_category: 4,
    abs_value: 1013,
    value: 3,
  },
  {
    source_category: 5,
    source_value: "FY21",
    target_category: 4,
    abs_value: 2568,
    value: 7.6,
  },
  {
    source_category: 5,
    source_value: "FY21",
    target_category: 3,
    abs_value: 2399,
    value: 7.1,
  },
  {
    source_category: 5,
    source_value: "FY21",
    target_category: 1,
    abs_value: 2960,
    value: 8.8,
  },
  {
    source_category: 5,
    source_value: "FY21",
    target_category: 2,
    abs_value: 2488,
    value: 7.4,
  },
  {
    source_category: 5,
    source_value: "FY21",
    target_category: 5,
    abs_value: 7616,
    value: 22.6,
  },
];

var config = {
  colors: {
    source: ["#FF00FF", "#FFC0CB", "#FFFF00", "#00FF00", "#FFA500"],
    target: ["#FF00FF", "#FFC0CB", "#FFFF00", "#00FF00", "#FFA500"],
  },
  nodecolors: [
    { node: 5, value: "light" },
    { node: 4, value: "dark" },
    { node: 3, value: "dark" },
    { node: 2, value: "dark" },
    { node: 1, value: "dark" },
  ],
  Headings: ["Recency", "Frequency"],
};
render_sankey_vega_chart(chart_data, "#sankey_chart", config);
Tooltip
HTML
Add this in html page to template tooltip.
<script type="text/html" id="chart_tooltip">
<div class="tooltip shadow" role="tooltip">
<div
class="rounded tooltip-inner text-dark text-left p-0 bg-dark">
<!-- sankey tooltip -->
<% var seg_insights_data = {section_4: {
customers: {
recency: {
title: "Recency",
text: [
"",
"Recency {yr}",
"",
"{recency}%({cust_count})",
"of the total customers made a purchase in the",
"{fy_yr}",
"Out of",
"({cust_count}) customers:",
],
sub_text: [
"",
"{recency}% ({cust_count})",
" have a Frequency score of",
" {yr}",
],
},
frequency: {
title: "Frequency",
text: [
"",
"Frequency {yr}",
"",
" {frequency}%({cust_count})",
"of the total customers have a",
" '{level}'",
"Frequency score",
"",
" Out of",
"({cust_count}) customers:",
],
sub_text: [
"",
"{frequency}%({cust_count})",
" have a Recency score of",
" {yr}",
],
},
},
rev: {
recency: {
title: "Recency",
text: [
"",
"Recency {yr}",
"",
" Revenue",
"generated by customers in",
"{fy_yr}",
"is",
"{recency}%(${cust_count})",
"of the total revenue",
"",
" Out of",
"(${cust_count}):",
],
sub_text: [
"",
"{recency}% (${cust_count})",
" was generated by customers with a Frequency score of",
"{yr}",
],
},
frequency: {
title: "Frequency",
text: [
"",
"Frequency {yr}",
"",
" {frequency}%(${cust_count}) of the total revenue",
"was generated by customers having a",
"'{level}'",
"Frequency score ",
"",
"Out of",
"(${cust_count}):",
],
sub_text: [
"",
"{frequency}%(${cust_count})",
" was generated by customers having a Recency score of",
"{yr}",
],
},
},
margin: {
recency: {
title: "Recency",
text: [
"",
"Recency {yr}",
"",
" Gross Margin",
"generated by customers in",
"{fy_yr}",
"is",
"{recency}%(${cust_count})",
"Out of",
" (${cust_count}):",
],
sub_text: [
"",
"{recency}% (${cust_count})",
" was generated by customers with a Frequency score of",
" {yr}",
],
},
frequency: {
title: "Frequency",
text: [
"",
"Frequency {yr}",
"",
" {frequency}%(${cust_count}) of the total Gross Margin",
"was generated by customers having a",
"'{level}'",
"Frequency score",
"",
" Out of",
"(${cust_count}):",
],
sub_text: [
"",
"{frequency}%(${cust_count})",
" was generated by customers having a Recency score of",
" {yr}",
],
},
},
cross_tab: {
account: {
title: "Customer",
text: [
"",
"{percent}%({count})",
" of the",
"total customers",
"had",
"{x_label} {x_value}",
" and",
"{y_label} {y_value}",
],
},
revenue: {
title: "Revenue",
text: [
"",
"{percent}%(${count})",
" of",
"total revenue",
"was generated by customers having",
"{x_label} {x_value}",
" and",
"{y_label} {y_value}",
],
},
margin: {
title: "Gross Margin",
text: [
"",
"{percent}%(${count})",
" of",
"total Gross Margin",
"was generated by customers having",
"{x_label} {x_value}",
" and",
"{y_label} {y_value}",
],
},
},
}} %>
<% var size = 'customers' %>
<% if(item.fill != 'transparent'){ %>
<% var select_cat = $('#size').val() %>
<% var prefix = select_cat == 'margin' || select_cat == 'rev' ? '$' : '' %>
<% select_cat = select_cat == 'margin' ? 'Gross Margin' : select_cat == 'rev' ? 'Revenue' : 'Customers' %>
<% if(data.node_type == 'source') { %>
<p class="m-0 px-2">
<% var text = seg_insights_data['section_4'][size]['recency']['text'] %>
<% for(t in text){ %>
<span class="<%- t%2 !=0 ? 'font-weight-bold' : '' %>">
<%- text[t].replace("{yr}",data.node_value).replace("{recency}",_.round(_.sumBy(data.source_node,"value"))).replace("{fy_yr}",data.source_node[0].source_value).replaceAll("{cust_count}",format_revenue_number_sankey(_.sumBy(data.source_node, 'abs_value'))) %>
</span><% if(t==1 || t == (text.length - 3)){ %><br><%}%>
<% } %>
</p>
<% _.each(data.source_node, (d) => { %>
<p class="m-0 px-2">
<% var sub_text = seg_insights_data['section_4'][size]['recency']['sub_text'] %>
<% for(sub_t in sub_text){ %>
<span class="<%- sub_t%2 !=0 ? 'font-weight-bold' : '' %>">
<%- sub_text[sub_t].replace("{yr}",d.target_category).replace("{recency}",d.value).replace("{cust_count}",format_revenue_number_sankey(d.abs_value)) %>
</span>
<% } %>
</p>
<% }) %>
<% } %>
<% } %>
<% node_name = {'1':'Very Low','2':'Low','3':'Medium','4':'High','5':'Very High'} %>
<% if(data.node_type == 'target' && !_.isUndefined(data.node_value)) { %>
<p class="m-0 px-2">
<% var text = seg_insights_data['section_4'][size]['frequency']['text'] %>
<% for(t in text){ %>
<span class="<%- t%2 !=0 ? 'font-weight-bold' : '' %>">
<%- text[t].replace('{yr}',data.node_value).replace('{frequency}',_.round(data.node_sum)).replaceAll("{cust_count}",format_revenue_number_sankey(_.sumBy(data.target_node, 'abs_value'))).replace('{level}',node_name[data.node_value]) %>
</span><% if(t==1 || t == (text.length - 3)){ %><br><%}%>
<% } %>
</p>
<% _.sortBy() %>
<% _.each(data.target_node, (d) => { %>
<p class="m-0 px-2">
<% var sub_text = seg_insights_data['section_4'][size]['frequency']['sub_text'] %>
<% for(sub_t in sub_text){ %>
<span class="<%- sub_t%2 !=0 ? 'font-weight-bold' : '' %>">
<%- sub_text[sub_t].replace("{frequency}",d.value).replace("{cust_count}",format_revenue_number_sankey(d.abs_value)).replace("{yr}",d.source_category) %>
</span>
<% } %>
</p>
<% }) %>
<% } %>
<% if ($(item._svg.parentElement).hasClass('sankey_labels')) { %>
<% $(chart_id).attr('title', null) %>
<p class="m-0 px-2 "><%- item.tooltip %></p>
<% } %>
</div>
</div>
</script>- This is templated and called from index.js
Documentation
Authors and acknowledgment
Ushasree Ginne ushasree.ginne@gramener.com
License
ISC license
Project status
Sankey chart with tooltips is released. Enhancements will still be continued.