g2
v2.3.13
Published
An implementation of the Grammar of Graphics in javascript
Downloads
1,171
Readme
G2: The Grammar of Graphics
G2 是一个由纯 JavaScript 编写、强大的语义化图表生成工具,它提供了一整套图形语法,可以让用户通过简单的语法搭建出无数种图表,并且集成了大量的统计工具,支持多种坐标系绘制,可以让用户自由地定制图表,是为大数据时代而准备的强大的可视化工具。
G2 is a JavaScript library for visualizing data based on the Grammar of Graphics. G2 helps you bring data to life using Canvas and HTML. It provides a set of grammars, takes users beyond a limited set of charts to an almost unlimited world of graphical forms.
Want to learn more? See the guide,API,tutorial.
For examples, see the demo gallery.
Special thanks to Leland Wilkinson, the author of 《The Grammar Of Graphics》, whose book served as the foundation for G2.
Install
npm install g2Usage
var G2 = require('g2');Example

var G2 = require('g2');
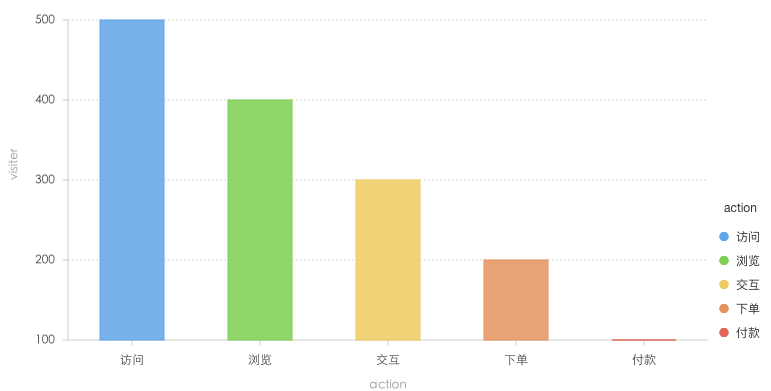
var data = [
  {action: '访问', visitor: 500},
  {action: '浏览', visitor: 400},
  {action: '交互', visitor: 300},
  {action: '下单', visitor: 200},
  {action: '付款', visitor: 100}
];
var chart = new G2.Chart({
  id: 'c1',
  width : 800,
  height : 400
}); // create the chart object
chart.source(data); // load the data source
chart.interval().position('action*visitor').color('action'); // create the detail chart
chart.render();
More details at G2 site.
体验改进计划说明
为了更好服务用户,G2 在 2.1.4 版本后第一次加载时,会将 URL 等信息发送回 G2 服务器:
https://kcart.alipay.com/web/bi.do除了 URL 与 G2 版本信息外,不会收集任何其他信息,一切为了能对 G2 的运行情况有更多了解,以更好服务于用户。如有担心,可以通过下面的代码关闭:
// 关闭 G2 的体验改进计划打点请求
G2.track(false)