
ember-google-charts
v1.8.3
Published
The default blueprint for ember-cli addons.
Downloads
1,513
Maintainers
 sir-dunxalot
Readme
Ember Google Charts 

Ember Google Charts makes it very easy to implement Google Charts in Ember CLI apps.
All dependencies are lazy loaded using the Google JS API Loader, which intelligently caches requests between a user's sessions.
Installation
ember install ember-google-chartsSee the demo app here.
Usage
Charts
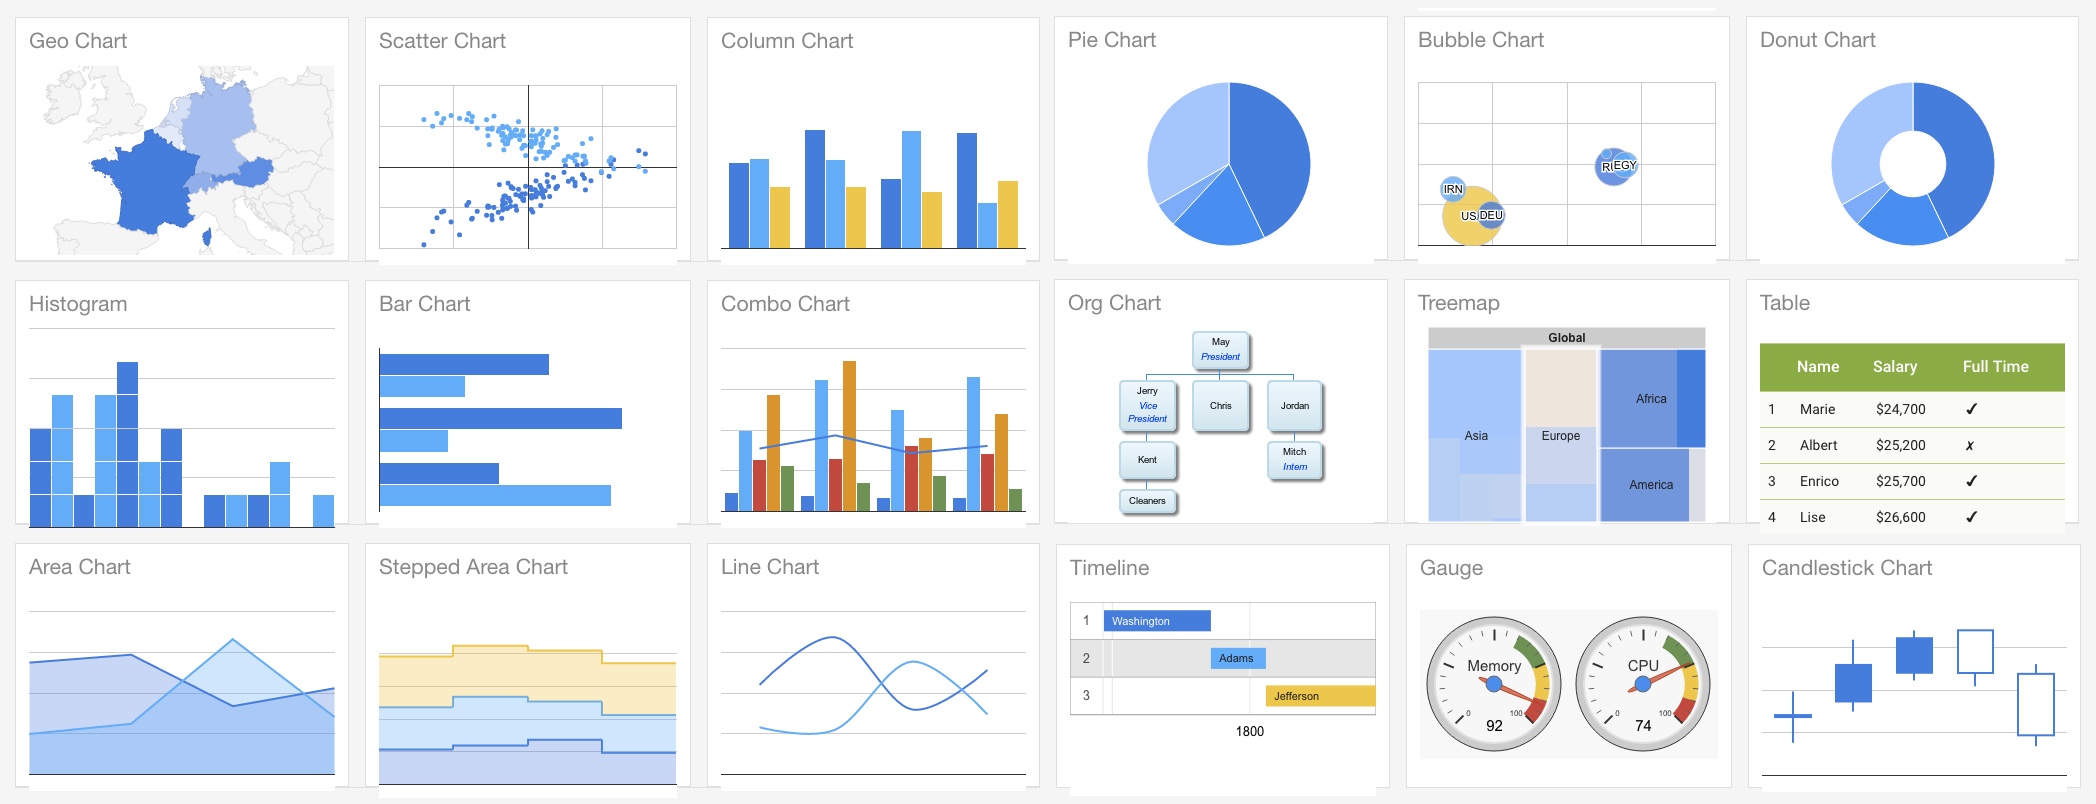
There are six types of chart supported out of the box:
- Area Charts (
{{area-chart}}) - Bar Charts (
{{bar-chart}}) - Geo Charts (
{{geo-chart}}) - Line Charts (
{{line-chart}}) - Pie Charts (
{{pie-chart}}) - Scatter Charts (
{{scatter-chart}})
To add a chart to any route, simply add the relevant component:
<AreaChart @data={{this.model}} @options={{this.options}} />Or if you're using an old template syntax:
{{area-chart data=data options=options}}Data and options should be in the format expected by the given chart, as detailed in the Google Charts documentation.
For example:
/* stats/route.js */

import Route from '@ember/routing/route';

export default Route.extend({

  model() {
    return [
      ['Task', 'Hours per Day'],
      ['Work', 11],
      ['Eat', 2],
      ['Commute', 2],
      ['Watch TV', 2],
      ['Sleep', 7],
    ];
  },

});
/* stats/controller.js */
import Controller from '@ember/controller';
export default Controller.extend({
options: {
title: 'How I spend my days',
height: 300,
width: 400,
animation: {
startup: true,
easing: 'inAndOut',
},
},
});{{!-- stats/template.hbs --}}
<PieChart @data={{this.model}} @options={{this.options}} />You can pass data as an array (see above example) or as a Google Data Table:
/* stats/route.js */

import Route from '@ember/routing/route';

export default Route.extend({

  model() {
    return google.visualization.arrayToDataTable([
      ['Year', 'Sales', 'Expenses'],
      ['2004', 1000, 400],
      ['2005', 1170, 460],
    ], false);
  },

});
{{!-- stats/template.hbs --}}
<PieChart @data={{this.model}} @options={{this.options}} />For more information about data tables and how to create them, see the Google Charts guides.
Where possible, this addon default to using Material Charts over Google's 'classic' design.
It's very easy to add non-default charts (e.g. table charts or gauge charts) - see the custom charts docs here
Design
Indicate which design you want: classic or material.
<BarChart @data={{this.model}} @options={{this.options}} @design="classic" />Only some chart types support Material Charts. See the Google Charts documentation Chart Types to learn more.
Default Options
Default options for all charts can be set in the GoogleChartsService.
Default options are always merged with the options you pass into a component. Passed in options will only override specific options properties, not the whole options object.
/* services/google-charts.js */

import GoogleChartsService from 'ember-google-charts/services/google-charts';

export default GoogleChartsService.extend({

  defaultOptions: {
    backgroundColor: '#389fcc',
    annotations: {
      alwaysOutside: true,
    },
  },

});
You can also set default options for individual components by overriding defaultOptions for the component. For example, if you want a custom chart component to use different default options:
/* components/gantt-chart.js */

import GoogleChart from 'ember-google-charts/components/google-chart';
import renderMaterialChart from 'ember-google-charts/utils/render-material-chart';

export default GoogleChart.extend({
  type: 'gantt',

  defaultOptions: {
    backgroundColor: '#389fcc',
    annotations: {
      alwaysOutside: true,
    },
  },

  renderChart: renderMaterialChart,
});
Locales
You can set the language of the charts you render by specifying the language code in the google-charts service:
/* services/google-charts.js */

import GoogleChartsService from 'ember-google-charts/services/google-charts';

export GoogleChartsService.extend({
  language: 'fr',
});
For more information on locales, see the Google Charts documentation.
Please note, Google Charts dependencies can only be loaded for a single language. This is a limitation of the Google API loader.
Resize
By default charts will rerender when the window size changes. You can opt out of this by setting responsiveResize to false:
{{pie-chart data=data responsiveResize=false}}Actions
Two actions are available for you to hook on to:
chartDidRender()
This fires when the Google chart has rendered and is ready for interaction via Google Charts public methods.
This action receives the chart object of the rendered chart.
/* stats/controller.js */

import Controller from '@ember/controller';

export default Controller.extend({

  actions: {
    selectCountry(chart) {
      chart.setSelection('someValue');
    },
  },

});
{{!-- stats/template.hbs --}}
<GeoChart
@data={{this.model}}
@options={{this.options}}
@chartDidRender=(action 'selectCountry')
/>packagesDidLoad()
This fires when the Google chart has finished loading the required Google packages for a specific chart.
This action receives no params.
/* stats/controller.js */

import Controller from '@ember/controller';

export default Controller.extend({

  actions: {
    checkGoogleExists() {
      if (window.google) {
        // Do something...
      }
    },
  },

});
{{!-- stats/template.hbs --}}
<LineChart
@data={{this.model}}
@options={{this.options}}
@packagesDidLoad=(action 'checkGoogleExists')
/>Events
It's easy to listen to events emitted by a chart:
/* stats/controller.js */

import Controller from '@ember/controller';

export default Controller.extend({

  actions: {
    addChartEventListeners(chart) {
      const { google: { visualization } } = window;

      visualization.events.addListener(chart, 'onmouseover', function(event) {
        /* Do something here... */;
      });
    }
  },

});
{{!-- stats/template.hbs --}}
<LineChart
@data={{this.model}}
@options={{this.options}}
@chartDidRender=(action 'addChartEventListeners')
/>For more information on events, see the Google Charts event documentation.
Custom Charts
All chart components in this addon extend from a single core component: the GoogleChartComponent.
- Find the type of chart in the Google guides and see what Google Charts package it requires
- Update the Google Chart service
packagesproperty with the new Google Charts package you require (if applicable) - Specify whether to use
'material'or'classic'design (depending on what Google Charts documentation says the chart type supports)
/* components/gantt-chart.js */

import GoogleChart from 'ember-google-charts/components/google-chart';

export default GoogleChart.extend({
  design: 'classic',
  type: 'gantt',
});
/* services/google-charts.js */
import GoogleChartsService from 'ember-google-charts/services/google-charts';
export GoogleChartsService.extend({
googlePackages: ['corechart', 'bar', 'line', 'scatter', 'gantt'], // Added gantt to defaults
});If preferred, you can write your own renderChart method. Use the renderChart util as your guide.
renderChart() receives the DOM Element in which to render the chart followed by the chart properties, which is an object that should include the following properties:
data(see usage instructions)design('material'or'classic')options(see usage instructions)type(e.g.'bar','line', etc)
renderChart() must return a promise that resolves with the chart object (resolve(chart)).
Content Security Policy
You will need to add the following to your app's content security policy to mitigate CSP errors:
contentSecurityPolicy: {
  'script-src': "'self' 'unsafe-eval' *.google.com *.gstatic.com",
  'style-src': "'self' 'unsafe-inline' *.google.com *.googleapis.com *.gstatic.com",
  'font-src': "'self' *.gstatic.com *.googleapis.com",
}
Testing
This addon makes two test helpers available that you can use in your app's test suite:
renderChart()assertChart()
renderChart()
renderChart() is an async helper that renders a chart using @ember/test-helpers's render() method.
You must pass in an ES6 tagged template string, as is expected by render(), documented here, so this helper is designed for use in integration tests.
For convenience, renderChart() returns the chart's DOM element.
For example:
/* tests/integration/some-test */

import { module } from 'qunit';
import { setupRenderingTest } from 'ember-qunit';
import { renderChart } from 'ember-google-charts/test-support';

module('Integration | Component | pretty color', function(hooks) {
  setupRenderingTest(hooks);

  test('Rendering the expenses chart', async function(assert) {
    this.set('data', [
      ['Year', 'Sales', 'Expenses'],
      ['2004', 1000, 400],
      ['2005', 1170, 460],
      ['2006', 660, 1120],
      ['2007', 1030, 540],
    ]);

    const chart = await renderChart(hbs`{{area-chart data=data}}`);

    /* Now run some assertions... */

    assert.ok(chart.textContent.indexOf('2007') > -1,
      'Should contain 2007 data');

  });

});
renderChart() adds a delay to your test suite that can be removed if you desire (but this may fail test suites in remote environments, like Travis):
const chart = await renderChart(hbs`{{area-chart data=data}}`, {
  delay: 0, // Or some number of milliseconds
});
assertChart()
assertChart() runs a series of predefined assertions on any chart element to assert that the chart has been rendered correctly.
assertChart() expects several params to be passed:
assert, which is available in all 'ember-qunit' testschart, which is the chart's element and is returned by therenderChart()test helperproperties, which is an object that should include the properties passed into the chart component:datadesign('material'or'classic')optionstype(e.g.'bar','line', etc)
Here is an example, which also uses renderChart():
/* tests/integration/some-test */

import { module } from 'qunit';
import { setupRenderingTest } from 'ember-qunit';
import { assertChart, renderChart } from 'ember-google-charts/test-support';

module('Integration | Component | pretty color', function(hooks) {
  setupRenderingTest(hooks);

  const data = [
    ['Year', 'Sales', 'Expenses'],
    ['2004', 1000, 400],
    ['2005', 1170, 460],
    ['2006', 660, 1120],
    ['2007', 1030, 540],
  ];

  const options = {
    title: 'Yearly expenses',
    animation: {
      startup: true,
      easing: 'inAndOut',
    },
  };

  test('Rendering the expenses chart', async function(assert) {

    this.setProperties({
      data,
      options,
    });

    const chart = await renderChart(hbs`{{area-chart data=data options=options}}`);

    assertChart(assert, chart, {
      data,
      design: 'classic', // Because it's not a Material Chart
      options,
      type: 'area',
    });
  });
});
Development
All PRs and issues are welcome.
git clone https://github.com/sir-dunxalot/ember-google-charts.gitcd ember-tooltipsnpm install && bower installember sember test,ember try:testall, or the/testsroute
Please include tests and documentation updates with any new features.
You do not need to bump the version when you have a PR.
To release an update to the demo app:
git checkout master # make sure you're on master branch
ember github-pages:commit --message "Some commit message" # Builds the app
git push origin gh-pages:gh-pages # Deploys the app