elenatorro-carto-vl
v0.1.0
Published
CARTO Vector library - test
Downloads
12
Readme
CARTO VL
CARTO VL is an open source JavaScript library for developers to create vector-based visualizations inside Location Intelligence applications.
Features
- Maps are rendered client-side, instead of being rendered on the server. As a result, we provide faster load times and overall app performance by eliminating potential server problems.
- Built-in smart point aggregations and geometry simplifications making it easier than ever to visualize and interact with larger datasets. CARTO VL does this in a dynamic and automatic way, meaning you don’t need to rerun costly and time-expensive pre-processing steps over the geometry.
- Ability to modify geometries directly in the browser. This is a powerful solution for animated visualizations of points, lines, and polygons.
- Full control over everything happening on the map and can provide rich reactions to user interactions.
- New and intuitive map styling language that is designed specifically for multi-scale, thematic cartography. With just a few lines, complex visualizations can be created. Non-programmers can create their first map easily, while programmers will still be able to exploit the full potential of the CARTO ecosystem.


Example
Run this
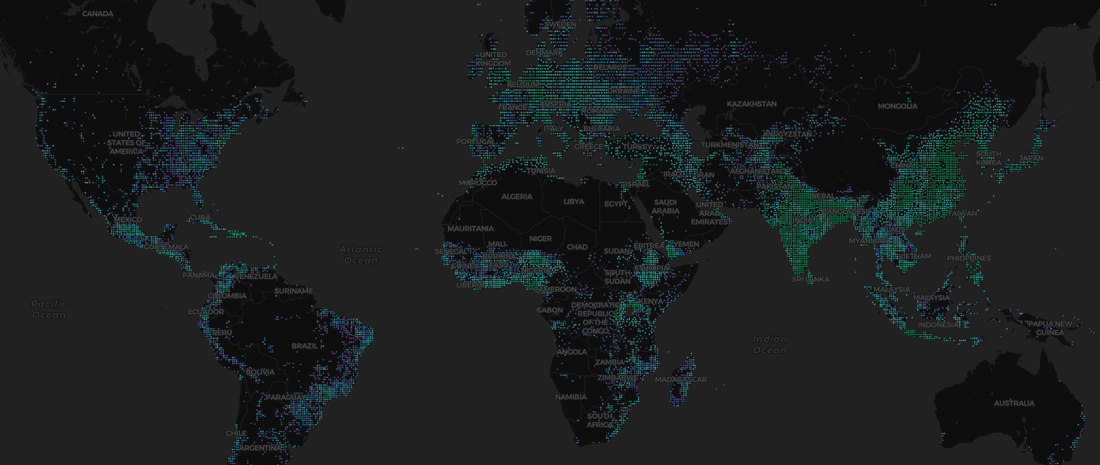
width: 8
color: ramp(buckets($dn, [80, 100, 140]), prism)
strokeWidth: 0
filter: $dn > 60
To see

I want to make a map
To start, you will need a basic HTML file structure to display your map in a browser. We recommend you to follow this Getting started guide to create a basic map. Then, you can get familiarized with the rest of the library following this link: https://carto.com/developers/carto-vl/guides/introduction/, which includes a list with more specific and advanced guides.
Also, take a look at our examples to understand the possibilities and inspire you!
An alternative way, if you already have a build system in your project (webpack, rollup...), is to use our npm package. You can install it with:
npm i @carto/carto-vlTake a look at an example made with webpack here.
Happy mapping!
I want to contribute to CARTO VL
That's great! We are more than happy to receive your contributions to the code and its documentation.
Install
To clone and run this library, you'll need Git and Node.js (which comes with npm) installed on your computer. From your command line:
# Clone this repository
$ git clone https://github.com/CartoDB/carto-vl

# Go into the repository
$ cd carto-vl

# Install dependencies (node >=6.11.5 is required)
$ yarn

# Bundle the library
$ yarn build
For more information, please read DEVELOPERS.md.
Start developing
Get started using CARTO VL's documentation at CARTO's Developer Center.
- Guides: get to know the library as a user!
- Full reference API: for specific methods, arguments, and sample code.
Play with the examples
You can find all the examples on the documentation in the examples folder. There are also some developer focused examples on the debug folder.
Run the following commands to access them locally:
# Bundle the library with a watch dog
$ yarn build:watch

# Run a server
$ yarn serve
Contributing
Lastly, check out CONTRIBUTING.md for more information about submitting pull requests to us. You will need to sign a Contributor License Agreement (CLA) before making a submission. Learn more here.
Feedback
We encourage you to start playing with CARTO VL and to please send us feedback so we can create an even better library, suited to your needs.
Works with
CARTO VL is a geo-spatial data visualization library. However it doesn't include basemap rendering capabilities. Therefore, CARTO VL needs to be used with Mapbox GL as a basemap provider. You'll need to use Mapbox GL (>=v.0.50.0) for controlling the center and zoom level of your map too. The integration is seamless, check the examples!
Versioning
We use SemVer for versioning. For the versions available, see the tags on this repository.
Authors
- David Manzanares
- Jesús Arroyo Torrens
- Iago Lastra
- Javier Goizueta
- Elena Torro
- Raúl Ochoa
- Mamata Akella
- Víctor Velarde
- Ariana Escobar
License
This project is licensed under the BSD 3-clause "New" or "Revised" License - see the LICENSE file for details.
BrowserStack
BrowserStack supports this OpenSource project, providing us with valuable tools to test CARTO VL over different systems and browsers configurations.
