d3-dynamic-graph
v1.3.0
Published
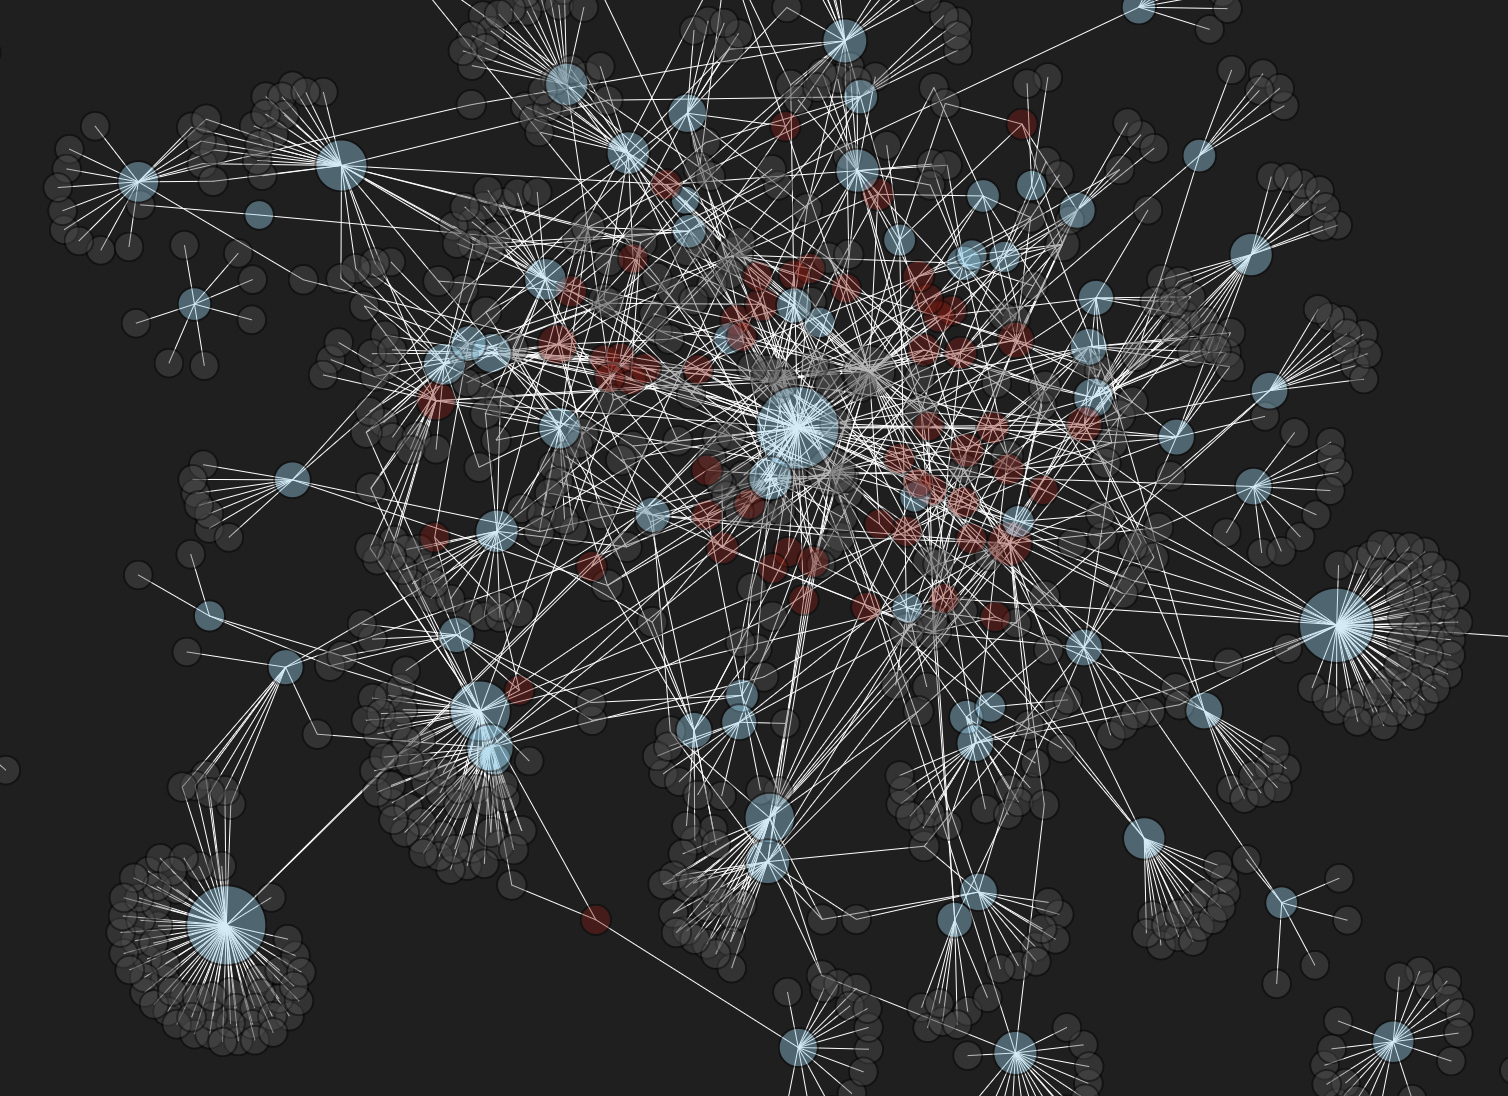
A high level API to create interactive, smoothly updating D3.js force-directed graph layout data visualizations
Downloads
36
Maintainers
Readme

d3-dynamic-graph
A high level class for creating interactive, dynamically updating D3.js force-directed graph layout visualizations.
npm i d3-dynamic-graphWhy do I need this?
Turns out transitioning and animating between states in D3 Force Layout is tricky requires 300+ lines of non-trivial code.
With DynamicGraph, you can smoothly update graphs with a single line of code.
Demo: Play with it in an Observable notebook
How to use d3-dynamic-graph
Run the example locally
npm install
npm run dev

# Build distrubition:
npm run build
Quickstart
Get your graph data in the format
const nodes = [{id: "foo", ...}, {id: "bar", ...}, ...]
const links = [{source: "foo", target: "bar"}, ...]
Create a parent container for the chart
<div id="d3-dynamic-graph-container"></div>Install package
npm i d3-dynamic-graphCreate a graph with default properties
import DynamicGraph from "DynamicGraph";
// client supplies d3, largely for Observable Notebook compatability
import * as d3 from "d3";

const container = d3.select("#d3-dynamic-graph-container");
const vis = DynamicGraph(container, d3).updateVis(nodes, links);
// Then, later, after you've updated nodes and links, call updateVis to transition:
vis.updateVis(updatedNodes, updatedLinks);
// Voila! The graph gracefuly transitions states.
DynamicGraph API:
You can set optional parameters on instantiation, otherwise they recieve these default values:
const vis = DynamicGraph(container, d3, {
  width: 600, // pixles
  height: 600, // pixles
  transitionTime: 750, // milliseconds
  centeringForce: 0.09,

  // e.g. Nodes: [{id: "foo"}, {id: "bar"}] Links: [{source: "foo", target: "bar"}]
  nodeRefProp: "id",
  unfocusOpacity: 0.4,
  focusOpacity: 0.95,
  unfocusStrokeThickness: 0.5,
  focusStrokeThickness: 5,

  // Link and Node functions
  linkColor: (link) => "white",
  nodeColor: (node) => "skyblue",
  nodeStartXPos: null, // function, returns pixels
  nodeStartYPos: null, // function, returns pixels
  nodeRadius: (node) => 5, // pixles

  // Tooltip:
  tooltipInnerHTML: (node) => node["id"],
  tooltipXOffset: 16,
  tooltipYOffset: 24,
});
A number of commonly used aspects of the graph can also be updating after instantiation (feel free to add a PR with more!)
const vis = DynamicGraph(d3.select("#dynamic-graph-container"), d3);
vis
  .nodeColor((node) => node.color)
  .nodeRadius((node) => node.radius)
  .tooltipInnerHTML((node) => "<div>" + node.info + "</div>");
For contributing to the package
npm run dev # start local server for examples

npm run build # build project, put output in /dist