chromium-remote-debugging-proxy
v0.6.1
Published
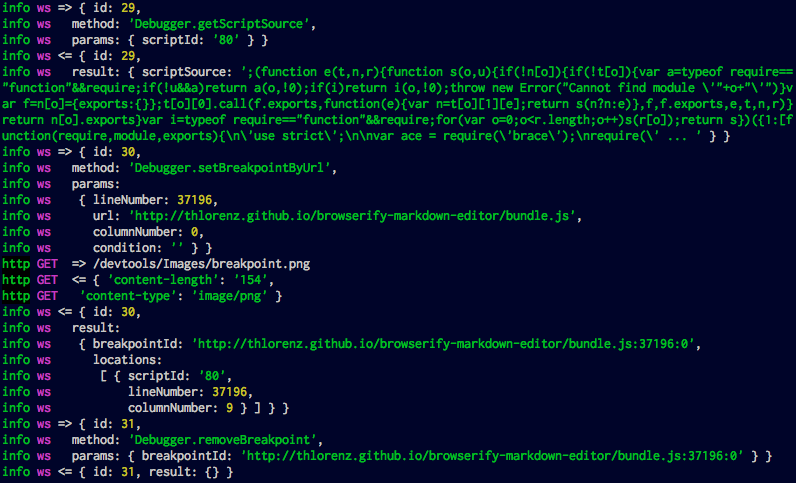
A proxy that sits in between a chromium devtools frontend and the remote chromium being debugged and logs requests, responses and websocket messages that are exchanged.
Downloads
14
Readme
chromium-remote-debugging-proxy
A proxy that sits in between a chromium devtools frontend and the remote chromium being debugged and logs requests, responses and websocket messages that are exchanged.

Usage
Start Proxy
crdpStart Chromium with remote debugging enabled
./Chromium.app/Contents/MacOS/Chromium --remote-debugging-port=9222 --no-sandboxOpen DevTools in another Browser
Make sure it points to the Proxy Port (by default REMOTE_PORT -1).
Installation
npm install chromium-remote-debugging-proxyProxy Usage
crdp <options>

Proxies requests from chromium devtools frontend and the remote chromium being debugged and logs requests, responses and websocket messages that are exchanged.

OPTIONS:

  -l, --loglevel  level at which to log: silly|verbose|info|warn|error|silent -- default: info

  -r, --remote    overrides port at which remote Chromium is listening, same as --remote-debugging-port (default: 9222)
  -p, --port      overrides proxy port (default: --remote - 1)
  -o, --outfile   if supplied all the incoming and outgoing messages are written to it as comma-delimited JSON, but requests and responses are not
                  all messages have a 'direction' attached to the message taking the view point of the DevTools frontend
                    outgoing: '=>'
                    incoming: '<='
                  in order to parse the resulting JSON remove the last ',' and surround it with [ ]

  -h, --help      Print this help message.


EXAMPLES:

  Assume Chromium is listening on remote debugging port 9222, make proxy listen on port 9221 and write JSON messages to ./messages.json

    crdp --remote 9222 -outfile messages.json
Visualizer Usage
In order to better understand the messages the crdp-visualize is included. It will sort messages and thus group
outgoing ones right next to the incoming message sent in response.
After generating a JSON message file via the crdp --outfile option do the following:
crdp-visualize ./path-to-file.json
open ./path-to-file.htmlLicense
MIT
