asingh-graph-library
v1.0.7
Published
A Graph Library using recharts
Downloads
18
Maintainers
Readme
asingh-graph-library for React
This is a simple and easy-to-use library for creating tailwind powered responsive bar charts in your React applications.
Installation
- If you don't already have a React application, you can create one using
npx create-react-app - Install the tailwind css in your React Application Installation Guide
- Install the library using
npm i asingh-graph-library - Import the
BarChartcomponent from the library:import {BarChart} from "asingh-graph-library"
Usage
To use the BarChart component, simply pass in the required props and see the chart come to life!
Props
labels: An array of label for the data points on the x-axis.data: An array of numerical data value corresponding to the labels.barColor: The color code in hex of the bars in the chart.showCartesianGrid: Whether to show the Cartesian grid lines.showTooltip: Whether to show tooltips on hover.
Example
import {BarChart} from "asingh-graph-library";

const App = ()=>{

    return(
    <>
        <div>
            <BarChart/>
        </div>
    </>
    )

}

export default App;
import {BarChart} from "asingh-graph-library";

const App = ()=>{

    return(
    <>
        <div>
            <BarChart
                labels={['Jan', 'Feb', 'Mar', 'Apr', 'May']}
                data={[10, 20, 30, 40, 50]}
                barColor="#4caf50"
                showCartesianGrid
                showTooltip
            />
        </div>
    </>
    )

}

export default App;
This will create a bar chart with the following specifications:
- Labels: Jan, Feb, Mar, Apr, May
- Data: 10, 20, 30, 40, 50
- Bar color: "#4CAF50" (green)
- Cartesian grid lines: Shown
- Tooltips: Shown
import {BarChart} from "asingh-graph-library";

const App = ()=>{

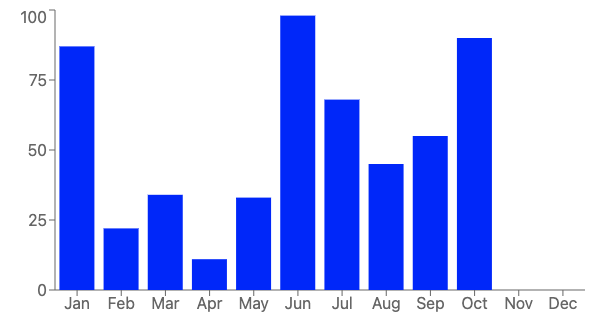
    const Months = ["Jan", "Feb", "Mar", "Apr", "May", "Jun", "Jul", "Aug", "Sep", "Oct", "Nov", "Dec"]

    const data = [87, 22, 34, 11, 33, 98, 68, 45, 55, 90]


    return(
    <>
        <div style={{width: 600, height: 200}}>
          <BarChart labels={Months} data={data}/>
        </div>
    </>
    )

}

export default App;
