
angular-d3-graphs
v0.0.11
Published
This project was generated with [Angular CLI](https://github.com/angular/angular-cli) version 10.0.4.
Downloads
8
Maintainers
 divesh.panwar
Readme
AngularD3Graphs
This project was generated with Angular CLI version 10.0.4.
Dependencies
- d3: ^5.16.0,
- @types/d3: ^5.7.2
Module
Import AngularD3GraphLibModule module in AppModule
HEAT MAP
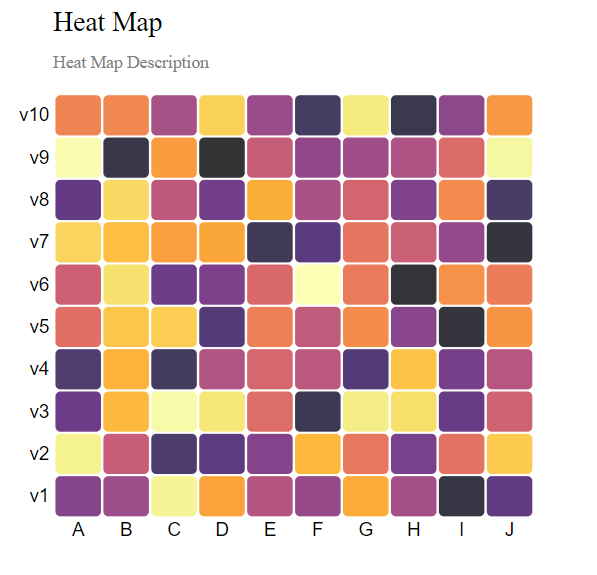 This component will generate a heat map. It has following properties:
- url [Input: string] : The url to a csv file, can be remote or local, default url is https://raw.githubusercontent.com/diveshpanwar/d3-graph-data/master/heat-map.csv
- description [Input: string] : The description to show on the heat map
- title [Input: string] : the title of the heat map
- margin [Input: objet] : the margins for the svg heat map, default { top: 80, right: 25, bottom: 30, left: 40 };
- width [Input: number] : the width of the heat map, default 400 - margin-left - margin-right
- height [Input: number] : the height of the heat map, default 460 - margin.top - margin.bottom
- groupColumnName [Input: string] : the group column name in the csv data, default 'group' CASE SENSITIVE
- variableColumnName [Input: string] : the variable column name in the csv data, default 'variable' CASE SENSITIVE
- valueColumnName [Input: string] : the value column name in the csv data, default 'value' CASE SENSITIVE
- xlow [Input: number] : the number less than or equal to lowest value x can assume, default 0
- xhigh [Input: number] : the number higher than or equal to highest value x can assume, default width
- ylow [Input: number] : the number less than or equal to lowest value y can assume, default height
- yhigh [Input: number] : the number higher than or equal to highest value y can assume, default 0
- tooltipLabel [Input: string] : the prefix of the tooltip
Bar Chart
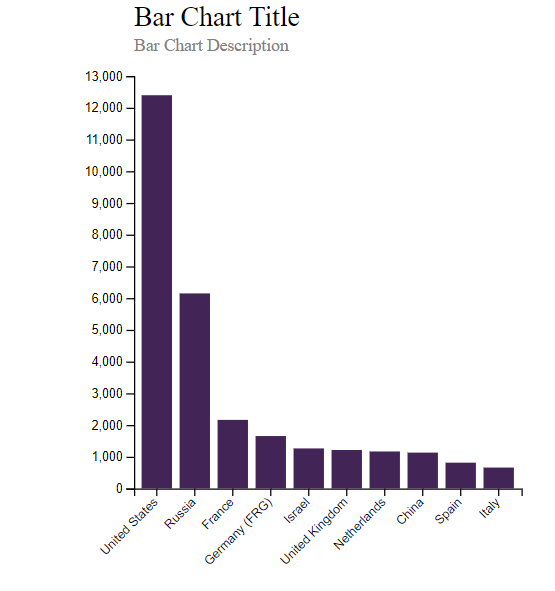 This component will generate a bar chart. It has following properties:
- url [Input: string] : The url to a csv file, can be remote or local, default csv url is https://raw.githubusercontent.com/diveshpanwar/d3-graph-data/master/bar-chart.csv
- description [Input: string] : The description to show on the bar chart
- title [Input: string] : the title of the bar chart
- margin [Input: objet] : the margins for the svg bar chart, default { top: 80, right: 25, bottom: 30, left: 40 };
- width [Input: number] : the width of the bar chart, default 400 - margin-left - margin-right
- height [Input: number] : the height of the bar chart, default 460 - margin.top - margin.bottom
- barColor [Input: string] : Hexa Decimal Code or color Name for the color of each bar, default color is '#432456'
- keyColumnName [Input: string] : the key column name in the csv data, default 'Country' CASE SENSITIVE
- valueColumnName [Input: string] : the value column name in the csv data, default 'Value' CASE SENSITIVE
- xlow [Input: number] : the number less than or equal to lowest value x can assume, default 0
- xhigh [Input: number] : the number higher than or equal to highest value x can assume, default width
- ylow [Input: number] : the number less than or equal to lowest value y can assume, default 0
- yhigh [Input: number] : the number higher than or equal to highest value y can assume, default 13000
Bubble Chart
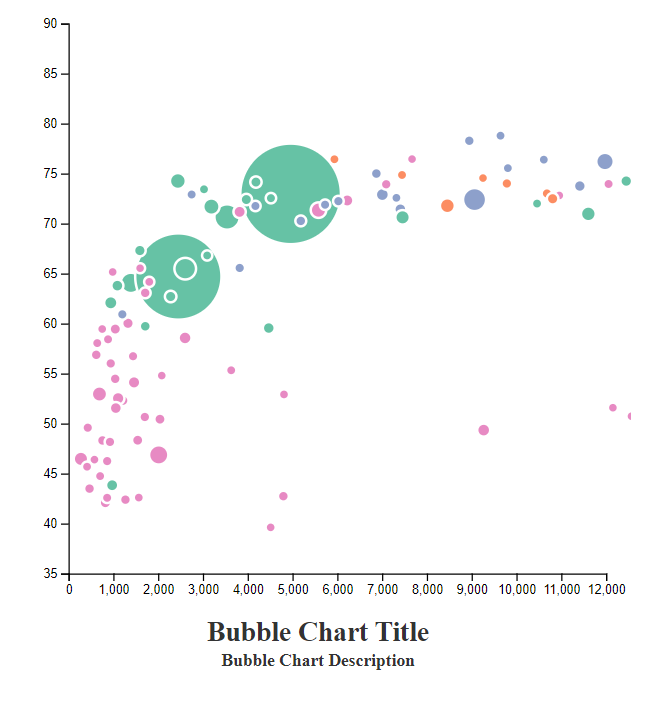 This component will generate a bubble chart. It has following properties:
- url [Input: string] : The url to a csv file, can be remote or local, default csv url is https://raw.githubusercontent.com/diveshpanwar/d3-graph-data/master/bubble-chart.csv
- columnOneName [Input: string] : the name of the first column name in the csv, default gdpPercap - Refer to the sample csv
- columnTwoName [Input: string] : the name of the second column name in the csv, default lifeExp - Refer to the sample csv
- columnThreeName [Input: string] : the name of the third column name in the csv, default pop - Refer to the sample csv
- columnFourName [Input: string] : the name of the fourth column name in the csv, default continent [Also used as domainList]- Refer to the sample csv
- columnFiveName [Input: string] : the name of the fifth column name in the csv, default country - Refer to the sample csv
- description [Input: string] : The description to show on the bubble chart
- title [Input: string] : the title of the bubble chart
- margin [Input: objet] : the margins for the svg bubble chart, default { top: 80, right: 25, bottom: 30, left: 40 };
- width [Input: number] : the width of the bubble chart, default 400 - margin-left - margin-right
- height [Input: number] : the height of the bubble chart, default 460 - margin.top - margin.bottom
- xlow [Input: number] : the number less than or equal to lowest value x can assume, default 0
- xhigh [Input: number] : the number higher than or equal to highest value x can assume, default width
- ylow [Input: number] : the number less than or equal to lowest value y can assume, default 0
- yhigh [Input: number] : the number higher than or equal to highest value y can assume, default 13000
- xTooltipLabel [Input: string] : Prefix of tooltip for Value x, default Country
- yTooltipLabel [Input: string] : Prefix of tooltip for Value y, default Life Expectency
- domainList [Input: string[] ] : the array fo strings to define the color scheme of the bubbles, default column four unique values, continent - Refer to the sample csv
Pie Chart
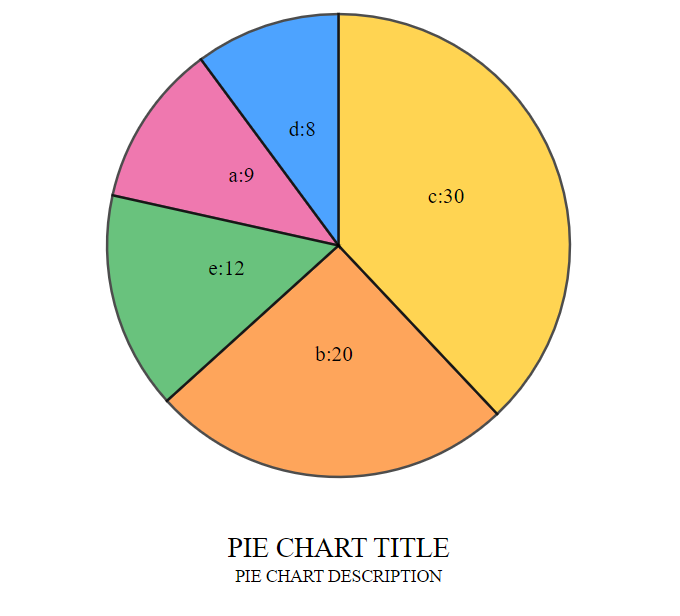 This component will generate a pie chart. It has following properties:
- url [Input: string] : The url to a json file, can be remote or local, default json url is https://raw.githubusercontent.com/diveshpanwar/d3-graph-data/master/pie-chart.json
- description [Input: string] : The description to show on the pie chart
- title [Input: string] : the title of the pie chart
- margin [Input: objet] : the margins for the svg pie chart, default 40
- width [Input: number] : the width of the pie chart, default 450
- height [Input: number] : the height of the pie chart, default 450
- prefixLabelName [Input: string] : the prefix to appear before the labels on the slices, default null
- radius [Input: number] : the height of the pie chart, default 20
Density Chart
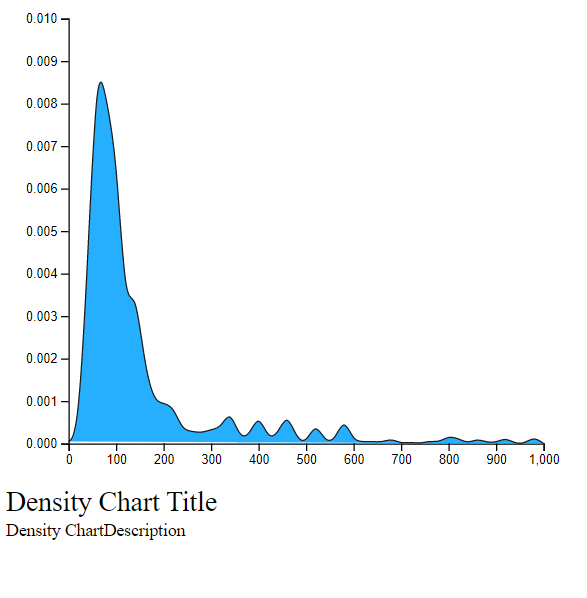 This component will generate a density chart. It has following properties:
- url [Input: string] : The url to a json file, can be remote or local, default json url is https://raw.githubusercontent.com/diveshpanwar/d3-graph-data/master/density-chart.csv
- description [Input: string] : The description to show on the density chart
- title [Input: string] : the title of the density chart
- margin [Input: objet] : the margins for the svg density chart, default { top: 30, right: 30, bottom: 30, left: 50 }
- width [Input: number] : the width of the density chart, default 460 - this.margin.left - this.margin.right
- height [Input: number] : the height of the density chart, default 400 - this.margin.top - this.margin.bottom
- columnName [Input: string] : the columnName of the data passed, default 'price'
- fillColor [Input: string] : the color of the density chart, default '0da6ff'