
@talrace/ngx-action-logger
v0.0.2
Published
## Description
Downloads
7


Readme
ngx-action-logger
Description
Logger for Angular applications, capable of both outputting data to the console or sending data to elastic. After sending to the elastic, you can view the data (for example, in kibana), build custom charts, etc. There are two decorators - LogComponentLifeCycle and Log. LogComponentLifeCycle - used for component life cycle logging, Log - function logging. Also, the logger can be used anywhere using DI. It is possible to expand the logged data or use your own service for logging that expands or complements the functionality.
Installation
Add LoggerModule to your AppModule
...
import { appModuleInjector, LoggerModule } from 'ngx-action-logger';
...

@NgModule({
    ...
    imports: [
        ...
        LoggerModule.forRoot({
            sessionId: 'uuid',
            elasticOptions: { index: 'yourIndex', url: 'http://localhost:9200', username: 'elastic', password: '123456' }
        }),
        ...
    ],
    ...
})
export class AppModule {
    constructor(protected injector: Injector) {
        appModuleInjector(injector);
    }
}
LogComponentLifeCycle decorator
@LogComponentLifeCycle({ className: 'UsersComponent', hooks: ['ngOnInit', 'ngOnDestroy'], message: 'customMessage' })
@Component({
    selector: 'app-users',
    templateUrl: './users.component.html',
    styleUrls: ['./users.component.scss'],
    changeDetection: ChangeDetectionStrategy.OnPush
})
export class UsersComponent {}
Log decorator
@Log({ className: 'UsersComponent', message: 'customMessage' })
onCancel(): void {}
Kibana example
After successfully sending the data to elastic, you can view the data and build graphs in kibana. For this you need:
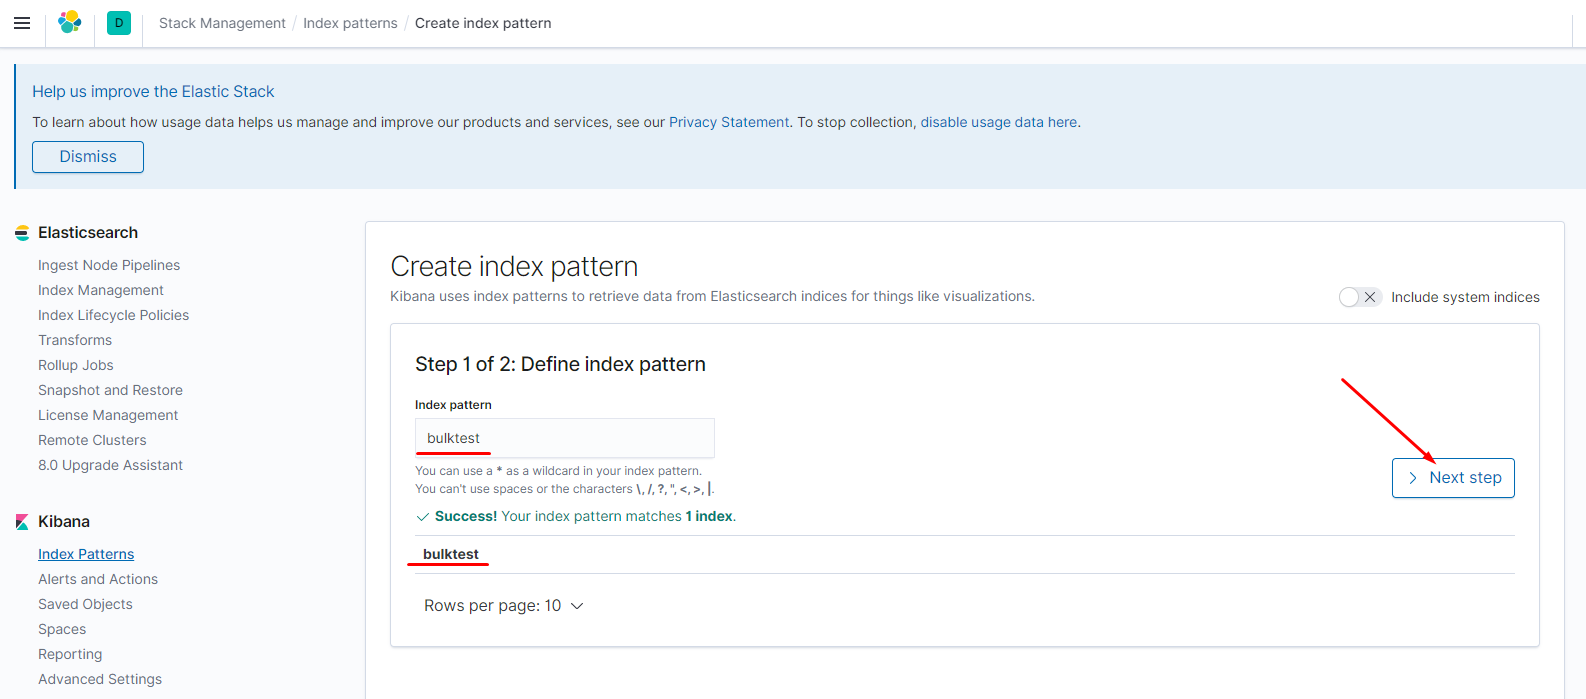
- Create new index patter (Stack Management -> Index patterns -> Create index pattern). Type your index name to the input and click "Next step".
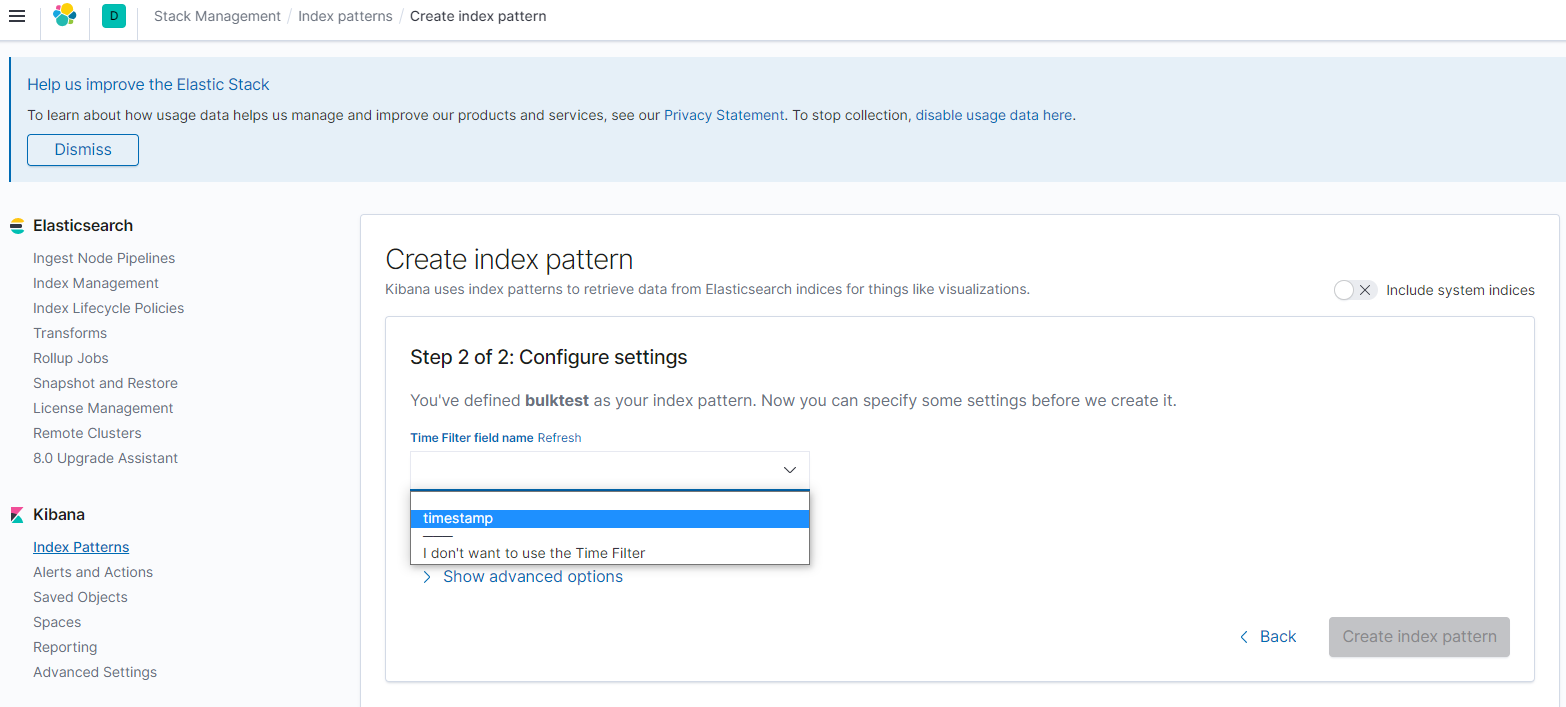
Select time filter filed (index by default contains "timestamp" filed with date property type by default) and click "Create index pattern".
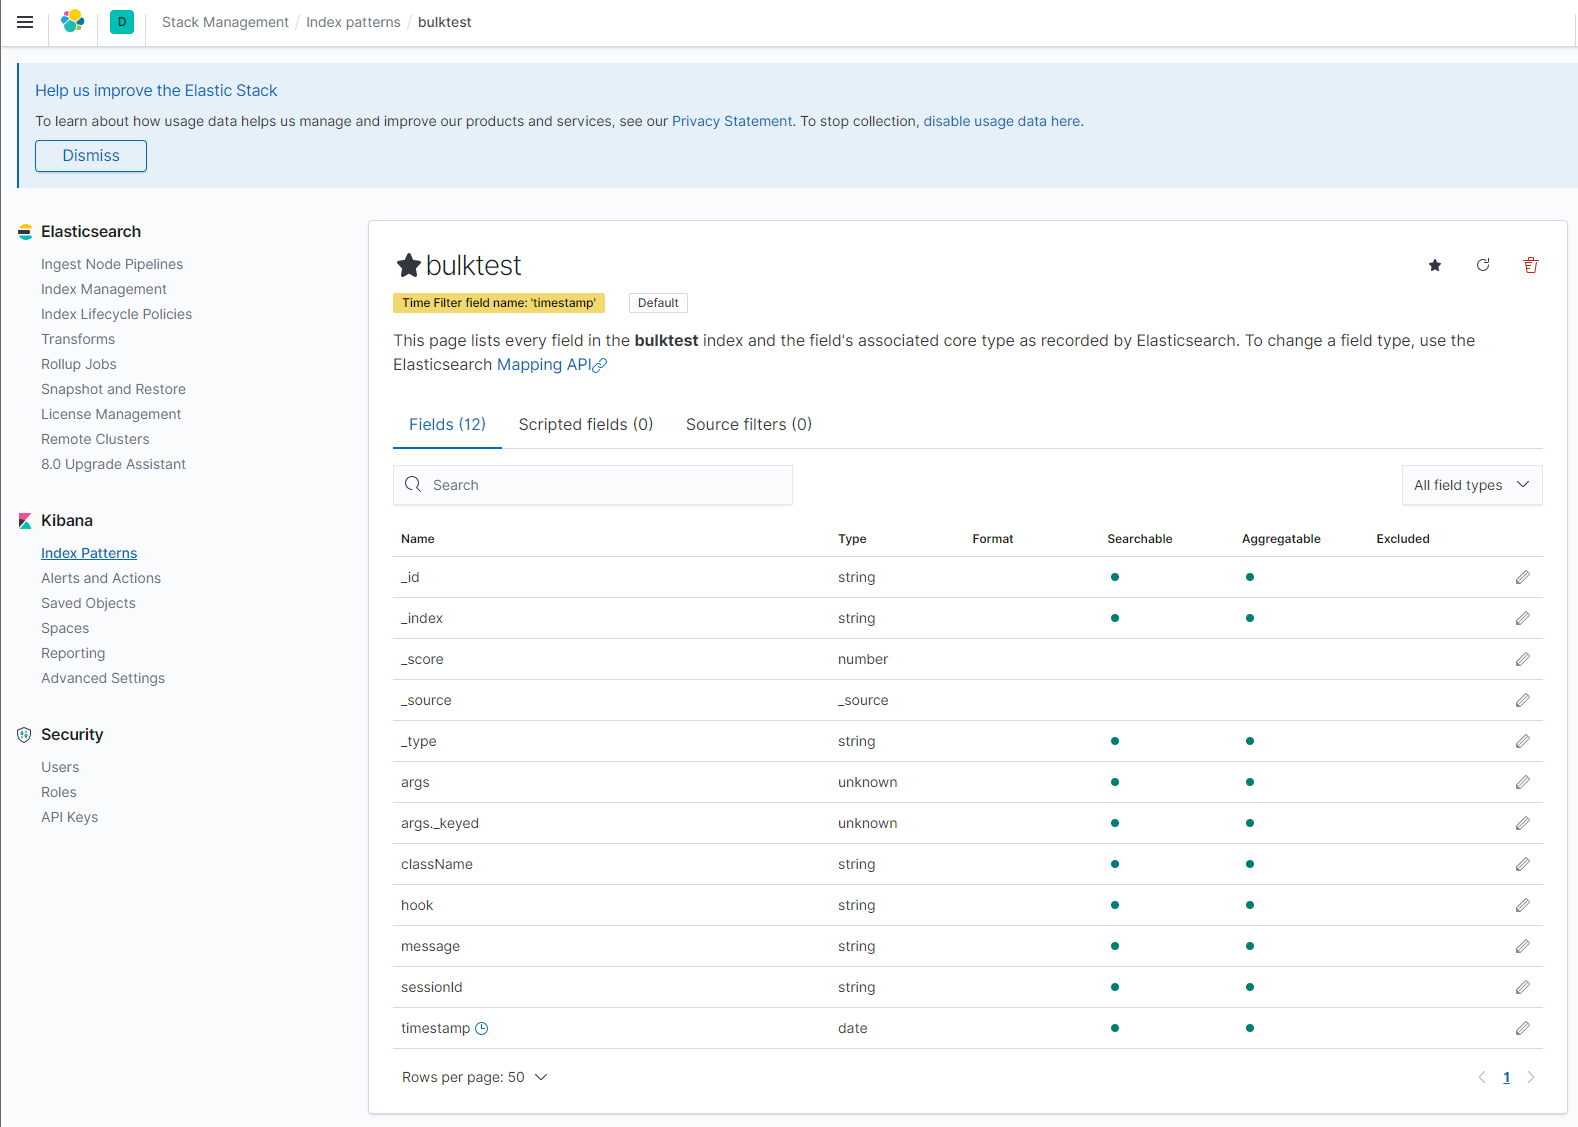
After some seconds you can see your created index pattern with all fields.
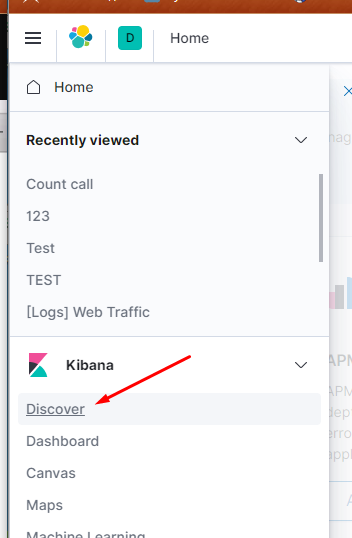
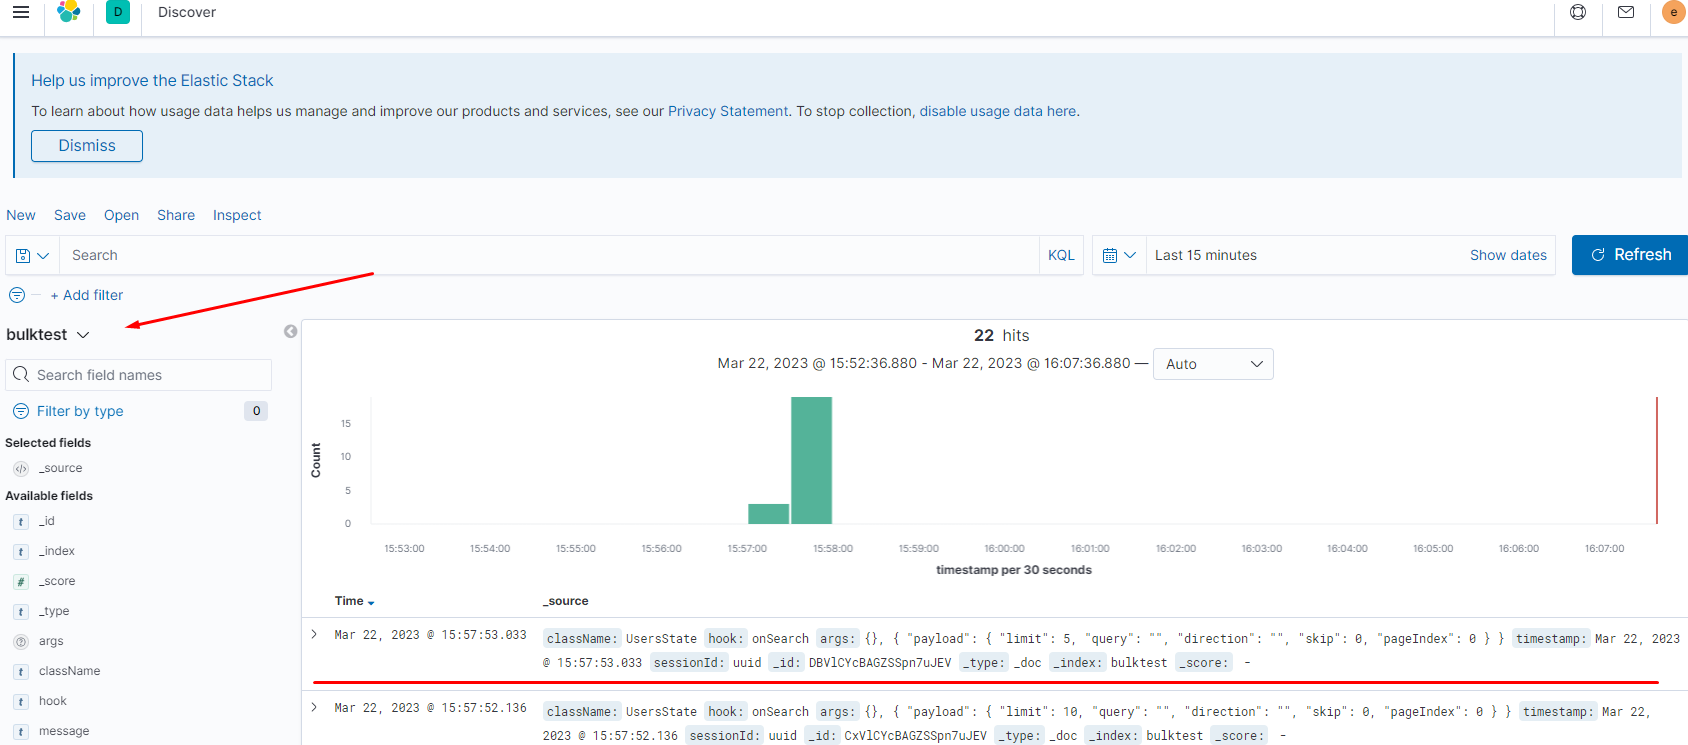
- You can discover index data. Open "Discover" page in kibana.
Select your index pattern and research incoming data. Use search if needed used KQL.
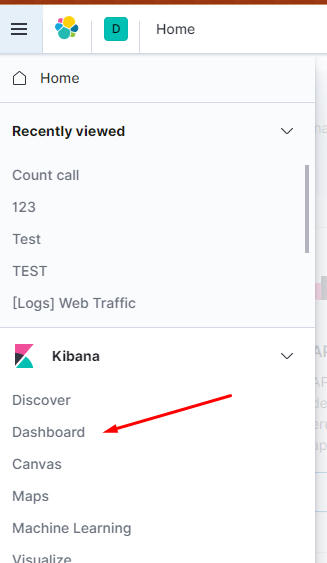
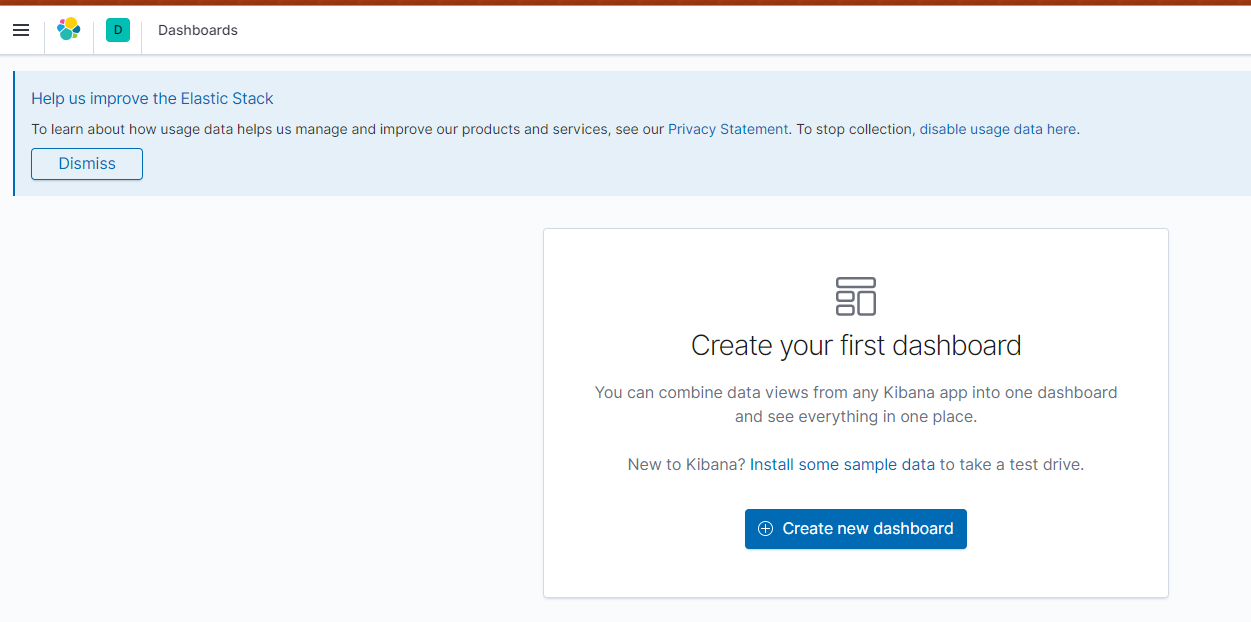
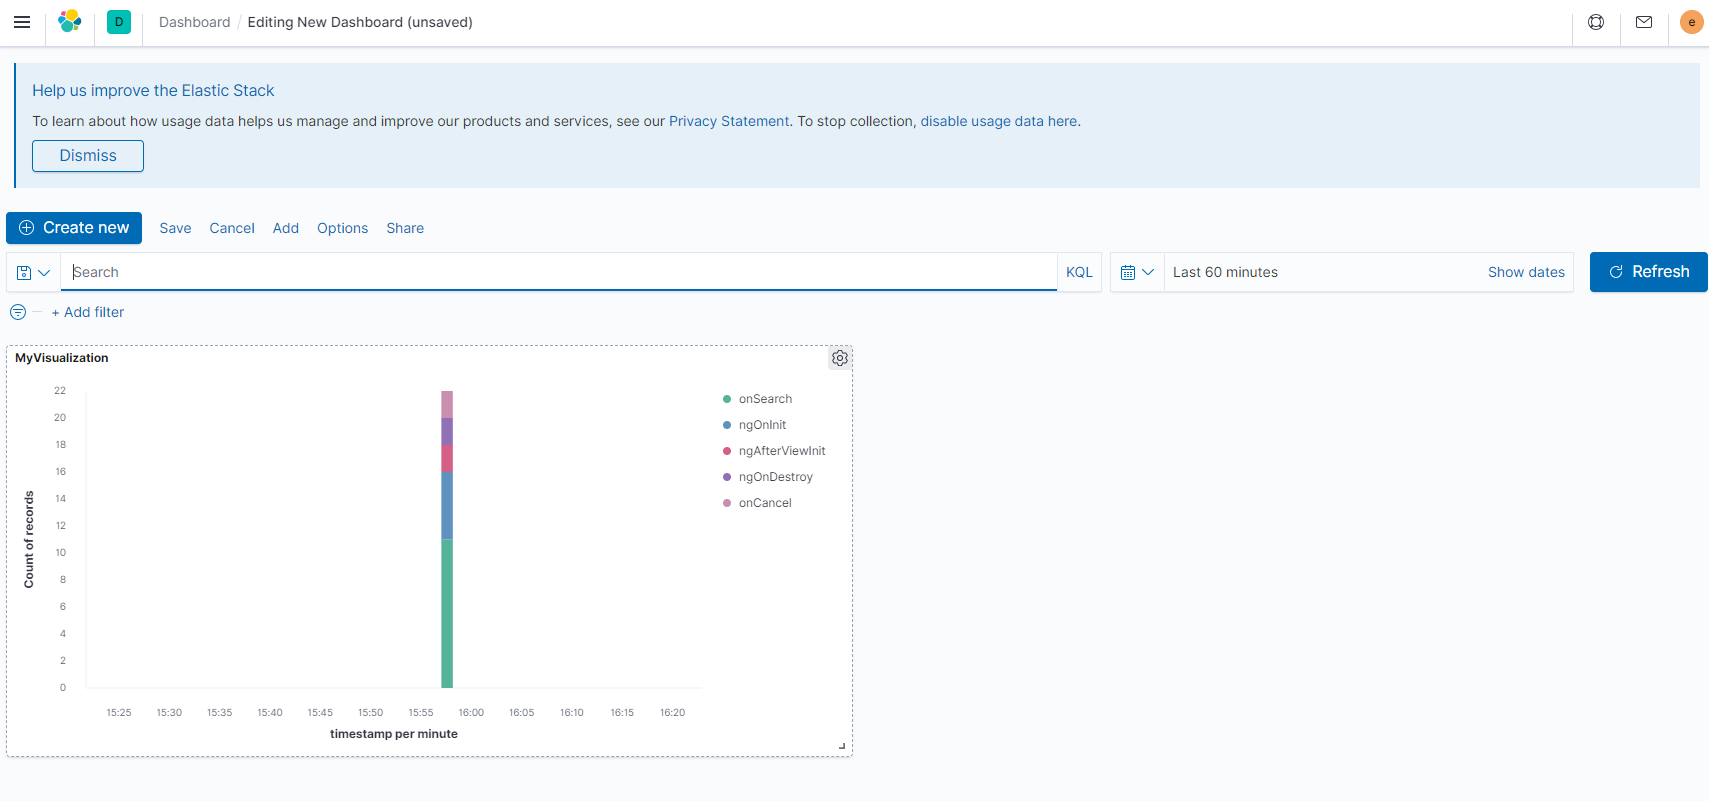
- You can combine data views from any Kibana app into one dashboard and see everything in one place. Open "Dashboards" page in kibana.
Select "Create new dashboard".
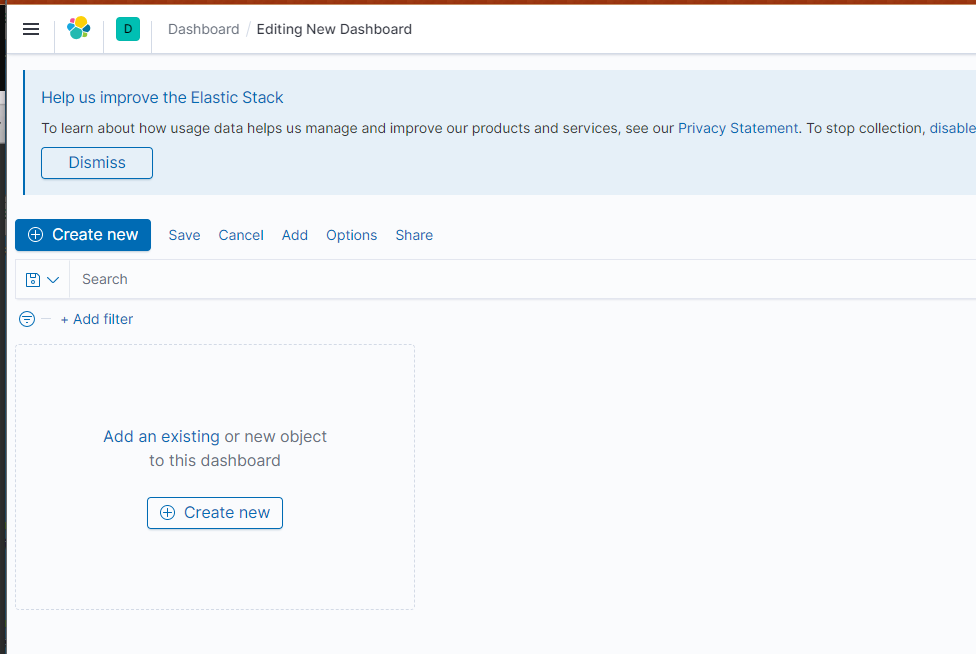
Add an existing or new object to this dashboard, click "Create new".
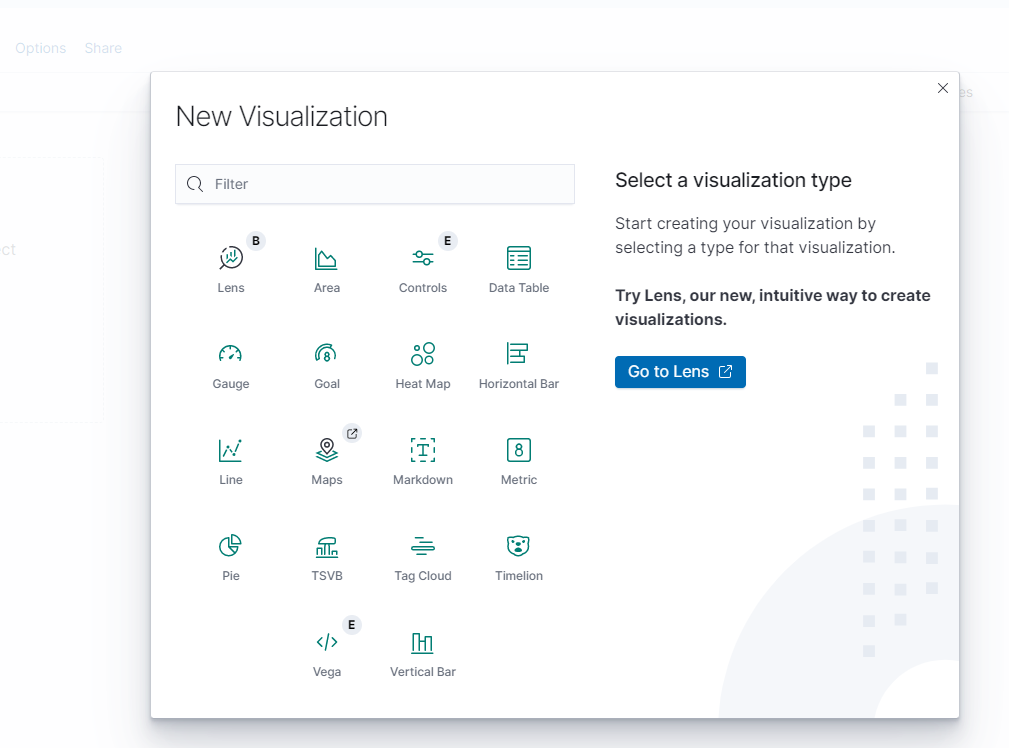
Select "Go to Lens" or select visualization.
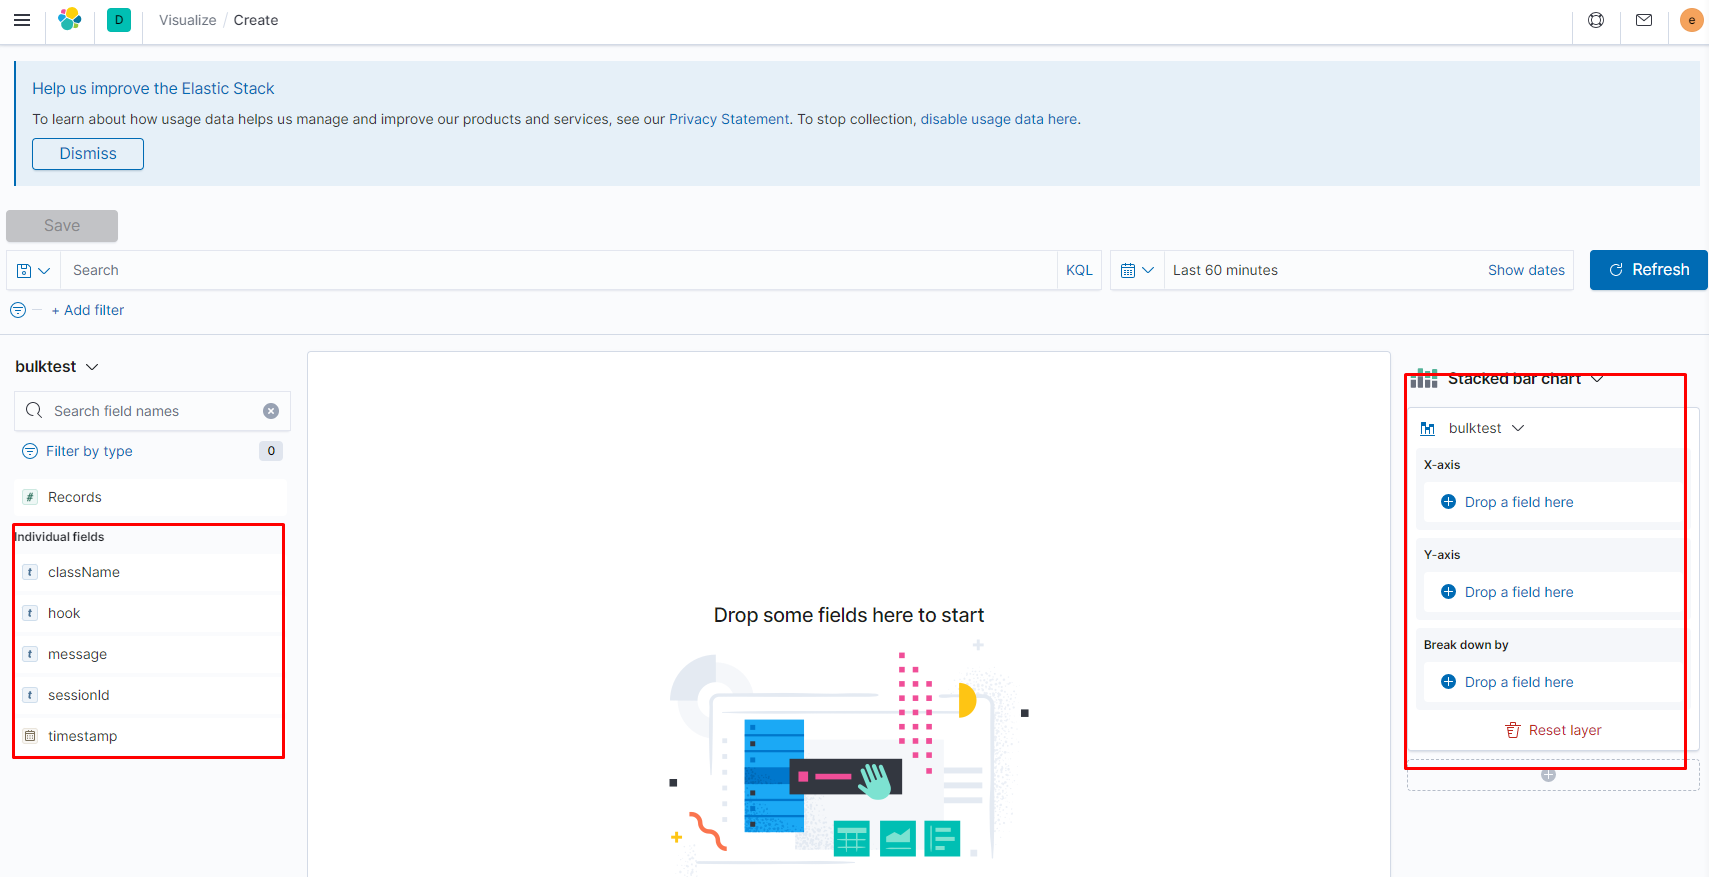
Drag any fields in left side and drop fields in center for display visualization.
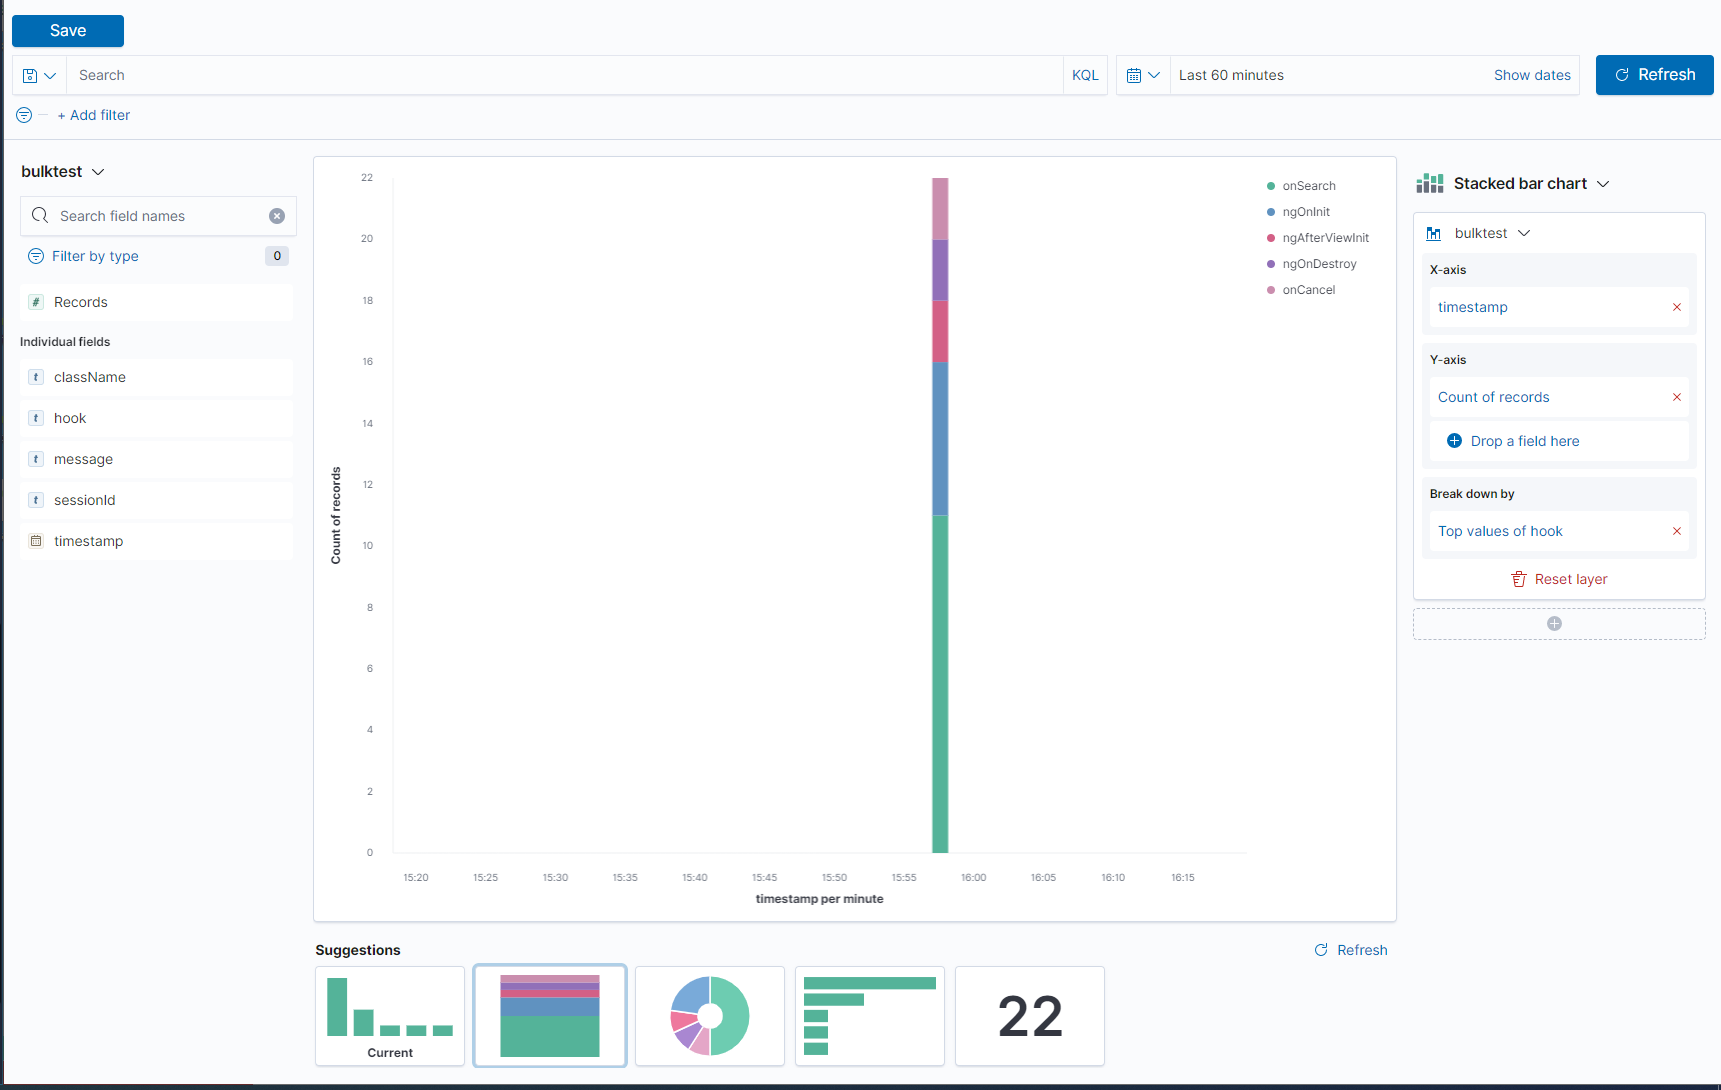
Select any other Suggestions or change settings in right side.
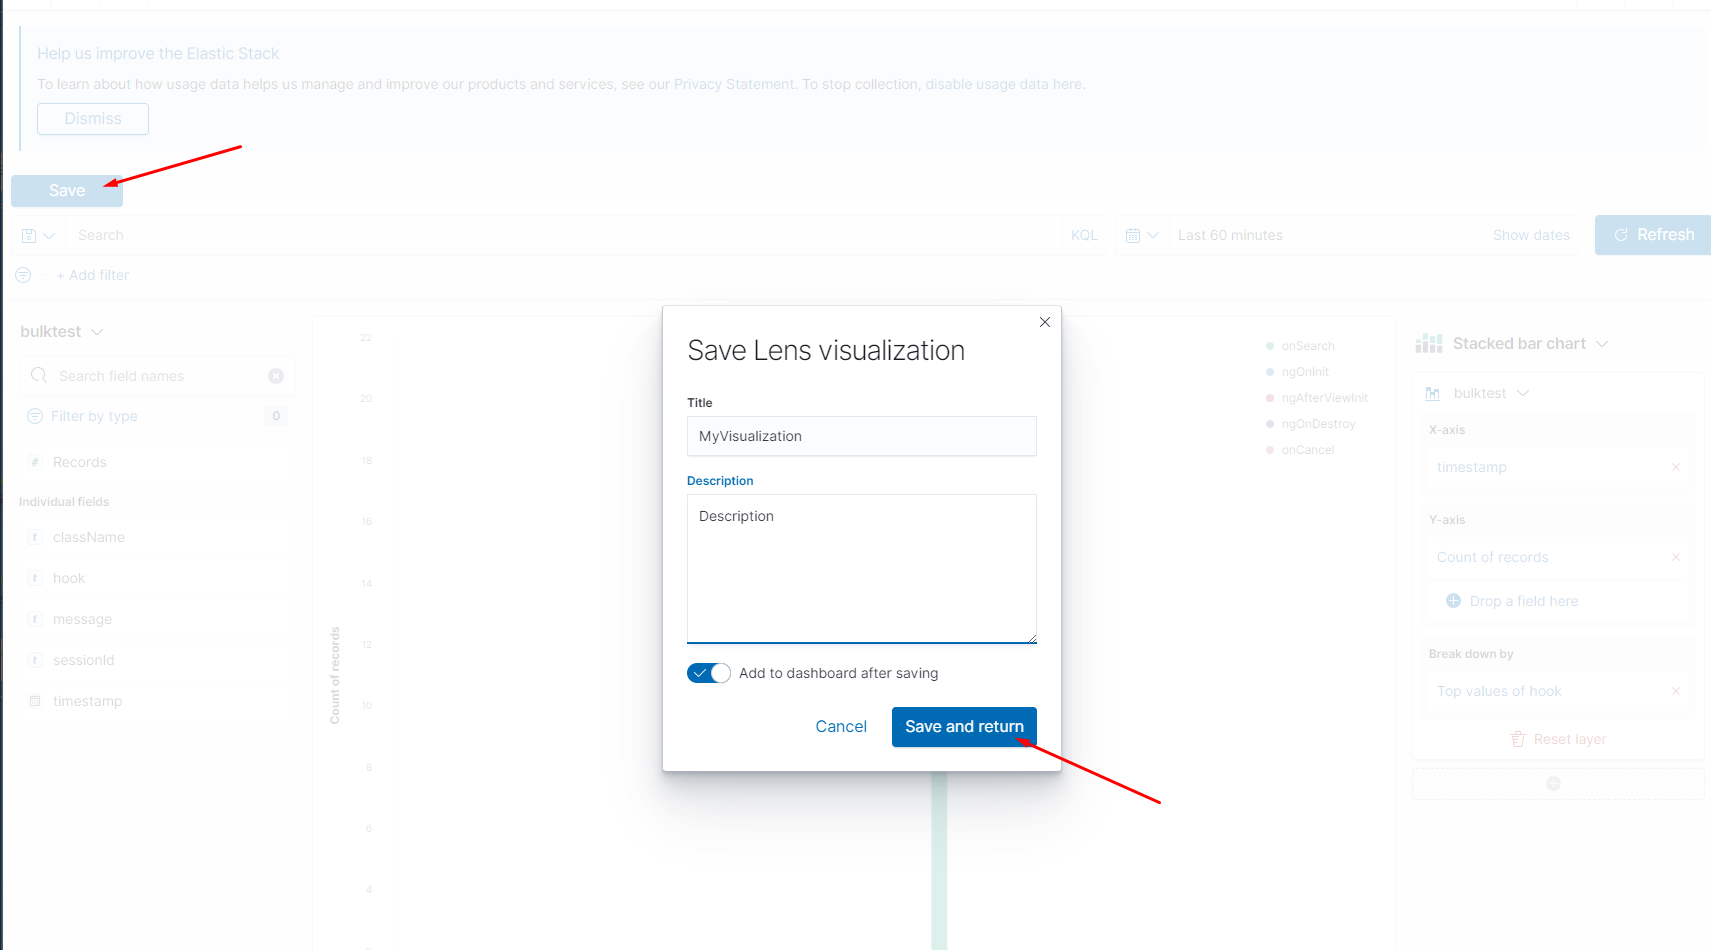
Save your visualization and Add title and description.
Create new visualization if needed.
API
Logger module used API:
LoggerModule
forRoot- used for add module to your project (see example)
ConsoleLoggerService
Logger by default. Logger use this service when not set other service in config or not set config for elastic. All incoming data in log shown in console
ElasticLoggerService
Send data to elastic for logging. You can check data in kibana or added custom dashboard graphics, for example.
url- elastic url for send dataindex- elastic index. Logger check index before send data, when index not exists - create index with typed propertiesusername- login for access to elasticpassword- password for access to elasticindexProperties?- custom mapping index properties (used DEFAULT_INDEX_PROPERTIES const when this property is empty)chunkSize?- max chuck with elastic data (used 100 when this property is empty)sendDataTimeout?- timeout between send data to elastic. Before send to elastic data is accumulated in a transaction (used 5000 milliseconds when this property is empty)
Decorators
LogComponentLifeCycle - life cycle decorator for components.
className?- custom class name for current component (by default used current class name, but in prod mode the class name is unreadable)message?- custom message, empty by defaulthooks?- component life cycle hooks for logging (if empty used DEFAULT_LOG_DECORATOR_LIFE_CYCLE_OPTIONS)
Log - logging decorator for functions
className?- custom class name for current class (by default used current class name, but in prod mode the class name is unreadable)message?- custom message, empty by default
Injector
appModuleInjector- set or get app injectorclearInjector- clear app injector
Const
DEFAULT_OPTIONS- default options for logger, user in logger initializationLOGGER_OPTIONS- injection token for logger optionsDEFAULT_LOG_DECORATOR_LIFE_CYCLE_OPTIONS- default logger hooks for LogComponentLifeCycle. Used by default when not set any hook in LogComponentLifeCycleDEFAULT_INDEX_PROPERTIES- json for create elastic index with typed properties