@objectivity/angular-schematic-ide
v11.0.0
Published
Configures IDE, adds common extensions and configurations
Downloads
27
Readme
Angular schematic ide
Configures IDE, adds common extensions and configurations.
Overview
ng add @objectivity/angular-schematic-ideOptions
VSCode
Getting Started
ng add @objectivity/angular-schematic-ide --vscodeRestart VS Code. It prompts a user to install the recommended extensions when a workspace is opened for the first time. The user can also review the list with the Extensions: Show Recommended Extensions command.

Extensions Included
Debugger for Chrome - Must have extension for Angular development. You can debug using chrome and add your breakpoints in VSCode. Tutorial on how to use can be found on VSCode docs.
TSLint - linter for the TypeScript language, help fixing error in TS code. By default auto fixing tslint errors on save is enabled.
Angular Language Service - provides a rich editing experience for Angular templates, very useful when working on Angular HTML template.
Angular 8 Snippets - Angular with TypeScript snippets.
Vscode-icons - provides lots of icons for Visual Studio Code.
EditorConfig for VS Code - EditorConfig Support for Visual Studio Code.
angular2-switcher - Easily navigate to typescript(.ts)|template(.html)|style(.scss/.sass/.less/.css) in angular projects.
alt+o(Windows) orshift+alt+o(macOS)- by default VSCode opens file not opened from file explorer in 'preview' mode. When using this extension, I also recommend the following setting:
workbench.editor.enablePreview": false
Auto Import - Automatically finds, parses and provides code actions and code completion for all available imports.
Auto Rename Tag - Auto rename paired HTML/XML tag.
Bracket Pair Colorizer - allows matching brackets to be identified with colours.
Sass Lint - integrates the sass-lint linter into VS Code.
Sort Typescript Imports - integrates the sass-lint linter into VS Code.
Code Spell Checker - A basic spell checker that works well with camelCase code.
Debugging
Start Debugging
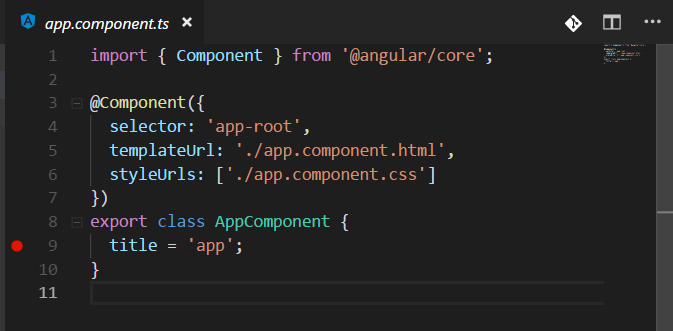
Set a breakpoint in app.component.ts on the line that sets the
titleproperty ofAppComponent. To set a breakpoint, click on the gutter to the left of the line numbers. This will set a breakpoint which will be visible as a red circle.
Open a terminal at the root folder and serve the app using Angular CLI:
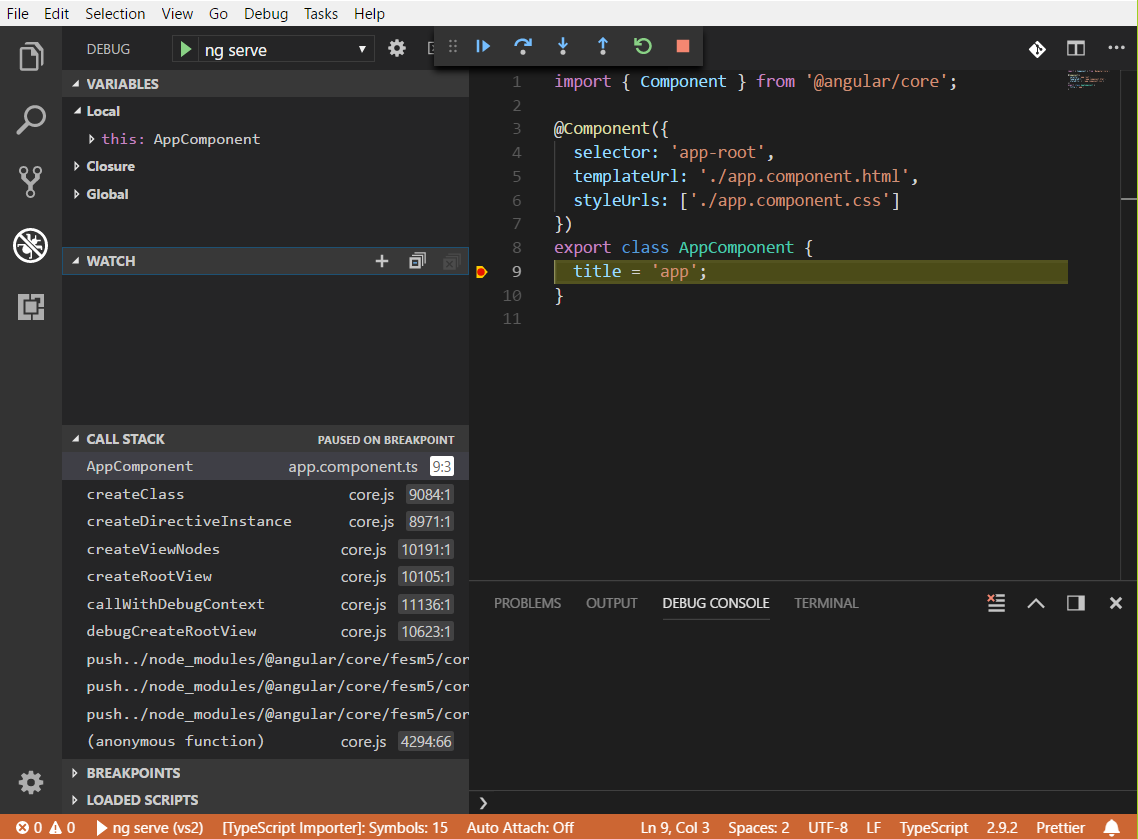
npm startGo to the Debug view, select the 'ng serve' configuration, then press F5 or click the green play button.
The app will be shown in a browser, but in order to hit the breakpoint you'll need to refresh the browser.

You can step through your source code (F10), inspect variables such as AppComponent, and see the call stack of the client side Angular application.
Debug Unit Tests
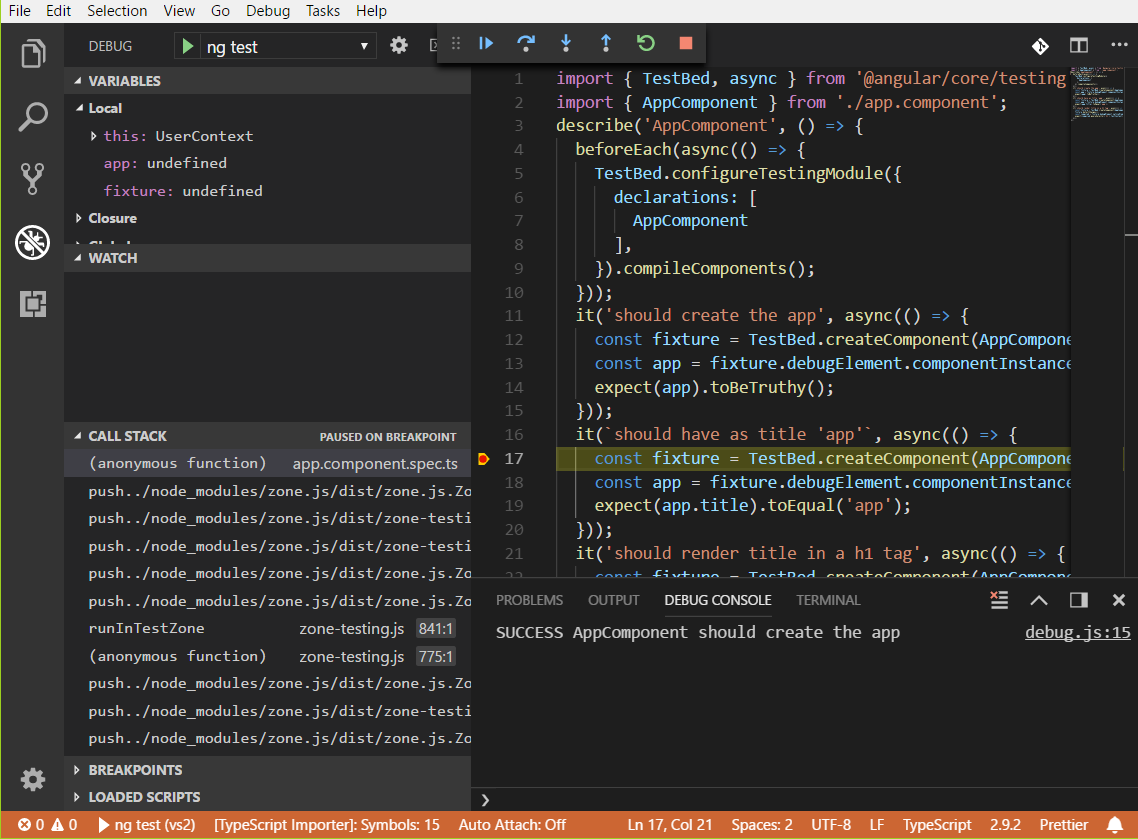
Set a breakpoint in app.component.spec.ts on a line in one of the unit tests.
Open a terminal at the root folder and run the tests using Angular CLI:
npm run testAfter the test run, go to the Debug view, select the 'ng test' configuration, then press F5 or click the green button.
When a browser opens with the test list, click the link for the test in which you placed the breakpoint. You should then hit the breakpoint:

