@node-projects/gitgraph-js
v2.1.0
Published
Draw pretty git graphs in the browser
Downloads
17
Readme
@gitgraph/js
Draw pretty git graphs with vanilla JS.
This is the vanilla JS rendering library of GitGraph.js.
👉 Try it with the online playground
Get started
You have 2 options:
- Get GitGraph.js bundle to use directly in your browser
- Get GitGraph from npm to use with a JS bundler
Browser bundle, ready to use
Get the bundle from one of the following sources:
- jsDelivr CDN: https://cdn.jsdelivr.net/npm/@gitgraph/js
- unpkg CDN: https://unpkg.com/@gitgraph/js
Create an index.html file and start coding:
<!DOCTYPE html>
<html>
<head>
  <!-- Load the JS file -->
  <script src="https://cdn.jsdelivr.net/npm/@gitgraph/js"></script>
</head>
<body>
  <!-- DOM element in which we'll mount our graph -->
  <div id="graph-container"></div>

  <!-- Use the `GitgraphJS` global variable to create your graph -->
  <script>
    // Get the graph container HTML element.
    const graphContainer = document.getElementById("graph-container");

    // Instantiate the graph.
    const gitgraph = GitgraphJS.createGitgraph(graphContainer);

    // Simulate git commands with Gitgraph API.
    const master = gitgraph.branch("master");
    master.commit("Initial commit");

    const develop = master.branch("develop");
    develop.commit("Add TypeScript");

    const aFeature = develop.branch("a-feature");
    aFeature
      .commit("Make it work")
      .commit("Make it right")
      .commit("Make it fast");

    develop.merge(aFeature);
    develop.commit("Prepare v1");

    master.merge(develop).tag("v1.0.0");
  </script>
</body>
</html>
Serve your files—with npm, you can run npx serve .
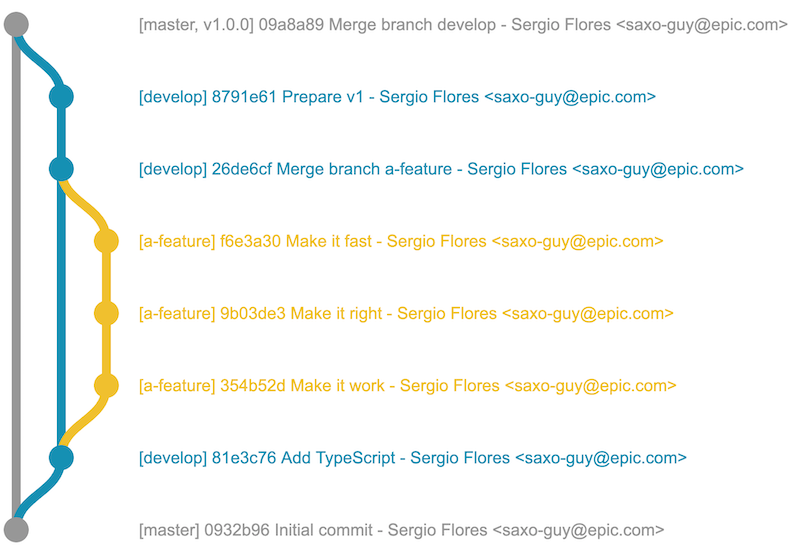
You should see the following graph:

Usage with a bundler (example with ParcelJS)
You need to have npm installed.
Create a new folder for your project and go there: mkdir your-project && cd your-project
Initialize your npm project: npm init -y
Install the package with npm: npm i --save @gitgraph/js
Install Parcel bundler: npm i --save-dev parcel-bundler
Now you can use createGitgraph to render your graph in a DOM element:
Create an index.html file:
<!DOCTYPE html>
<html>
<head>
  <!-- … -->
</head>
<body>
  <!-- DOM element in which we'll mount our graph -->
  <div id="graph-container"></div>

  <!-- This is for ParcelJS bundler -->
  <script src="./index.js"></script>
</body>
</html>
Create an index.js file:
import { createGitgraph } from "@gitgraph/js";

// Get the graph container HTML element.
const graphContainer = document.getElementById("graph-container");

// Instantiate the graph.
const gitgraph = createGitgraph(graphContainer);

// Simulate git commands with Gitgraph API.
const master = gitgraph.branch("master");
master.commit("Initial commit");

const develop = gitgraph.branch("develop");
develop.commit("Add TypeScript");

const aFeature = gitgraph.branch("a-feature");
aFeature
  .commit("Make it work")
  .commit("Make it right")
  .commit("Make it fast");

develop.merge(aFeature);
develop.commit("Prepare v1");

master.merge(develop).tag("v1.0.0");
Add start command in your package.json:
{
  "name": "your-project",
  "version": "1.0.0",
  "scripts": {
+   "start": "parcel index.html"
  }
Run npm start. You should see the following graph:

More examples
A bunch of scenarios has been simulated in our Storybook. Give them a look 👀
If you're coming from gitgraph.js package
Here's a guide to help you migrate to @gitgraph/js.


